Introduction: Embarking on the Illuminating Path of Candlestick Patterns
In the realm of trading, technical analysis holds a prominent position, empowering traders with the tools to decipher the intricate language of market movements. Among these tools, candlestick patterns stand out as invaluable navigational aids, providing insights into price trends and unlocking the secrets of market behavior. Whether you are a seasoned trader or a novice venturing into the captivating world of finance, understanding candlestick patterns is a gateway to unlocking the mysteries of the markets.

Image: www.vecteezy.com
Unveiling the Essence of Candlesticks: A Visual Symphony of Market Momentum
Candlestick charts, an ingenious visual representation of price action, emerged centuries ago in the Far East and have since become an indispensable element of technical analysis. These graphical wonders depict the dynamics of market movements through a series of candles, each representing a specific time period. The candlesticks’ unique shape conveys a wealth of information, including the opening, closing, high, and low prices within that timeframe.
Within the tapestry of candlestick patterns, two fundamental elements emerge: the “body” and the “shadow.” The body, a filled rectangle, represents the range between the opening and closing prices, while the shadow, a thin line extending above and below the body, signifies the price extremes reached during the period.
The Role of Candlestick Patterns in Unraveling Market Psychology
The true power of candlestick patterns lies in their ability to reflect market psychology. By observing the distinct visual patterns formed by the candlesticks, traders can garner valuable insights into the underlying sentiments and motivations driving market participants. For instance, a long, filled candle body suggests a strong directional move, while a smaller, less defined body indicates indecision or consolidation.
Classifying Candlestick Patterns: A Taxonomical Journey Through Market Formations
The universe of candlestick patterns is vast and diverse, encompassing a multitude of formations ranging from the simple to the intricate. Among the most common and widely recognized patterns are:

Image: toolzspot.in
Bullish Patterns: Portents of Ascendance and Optimism
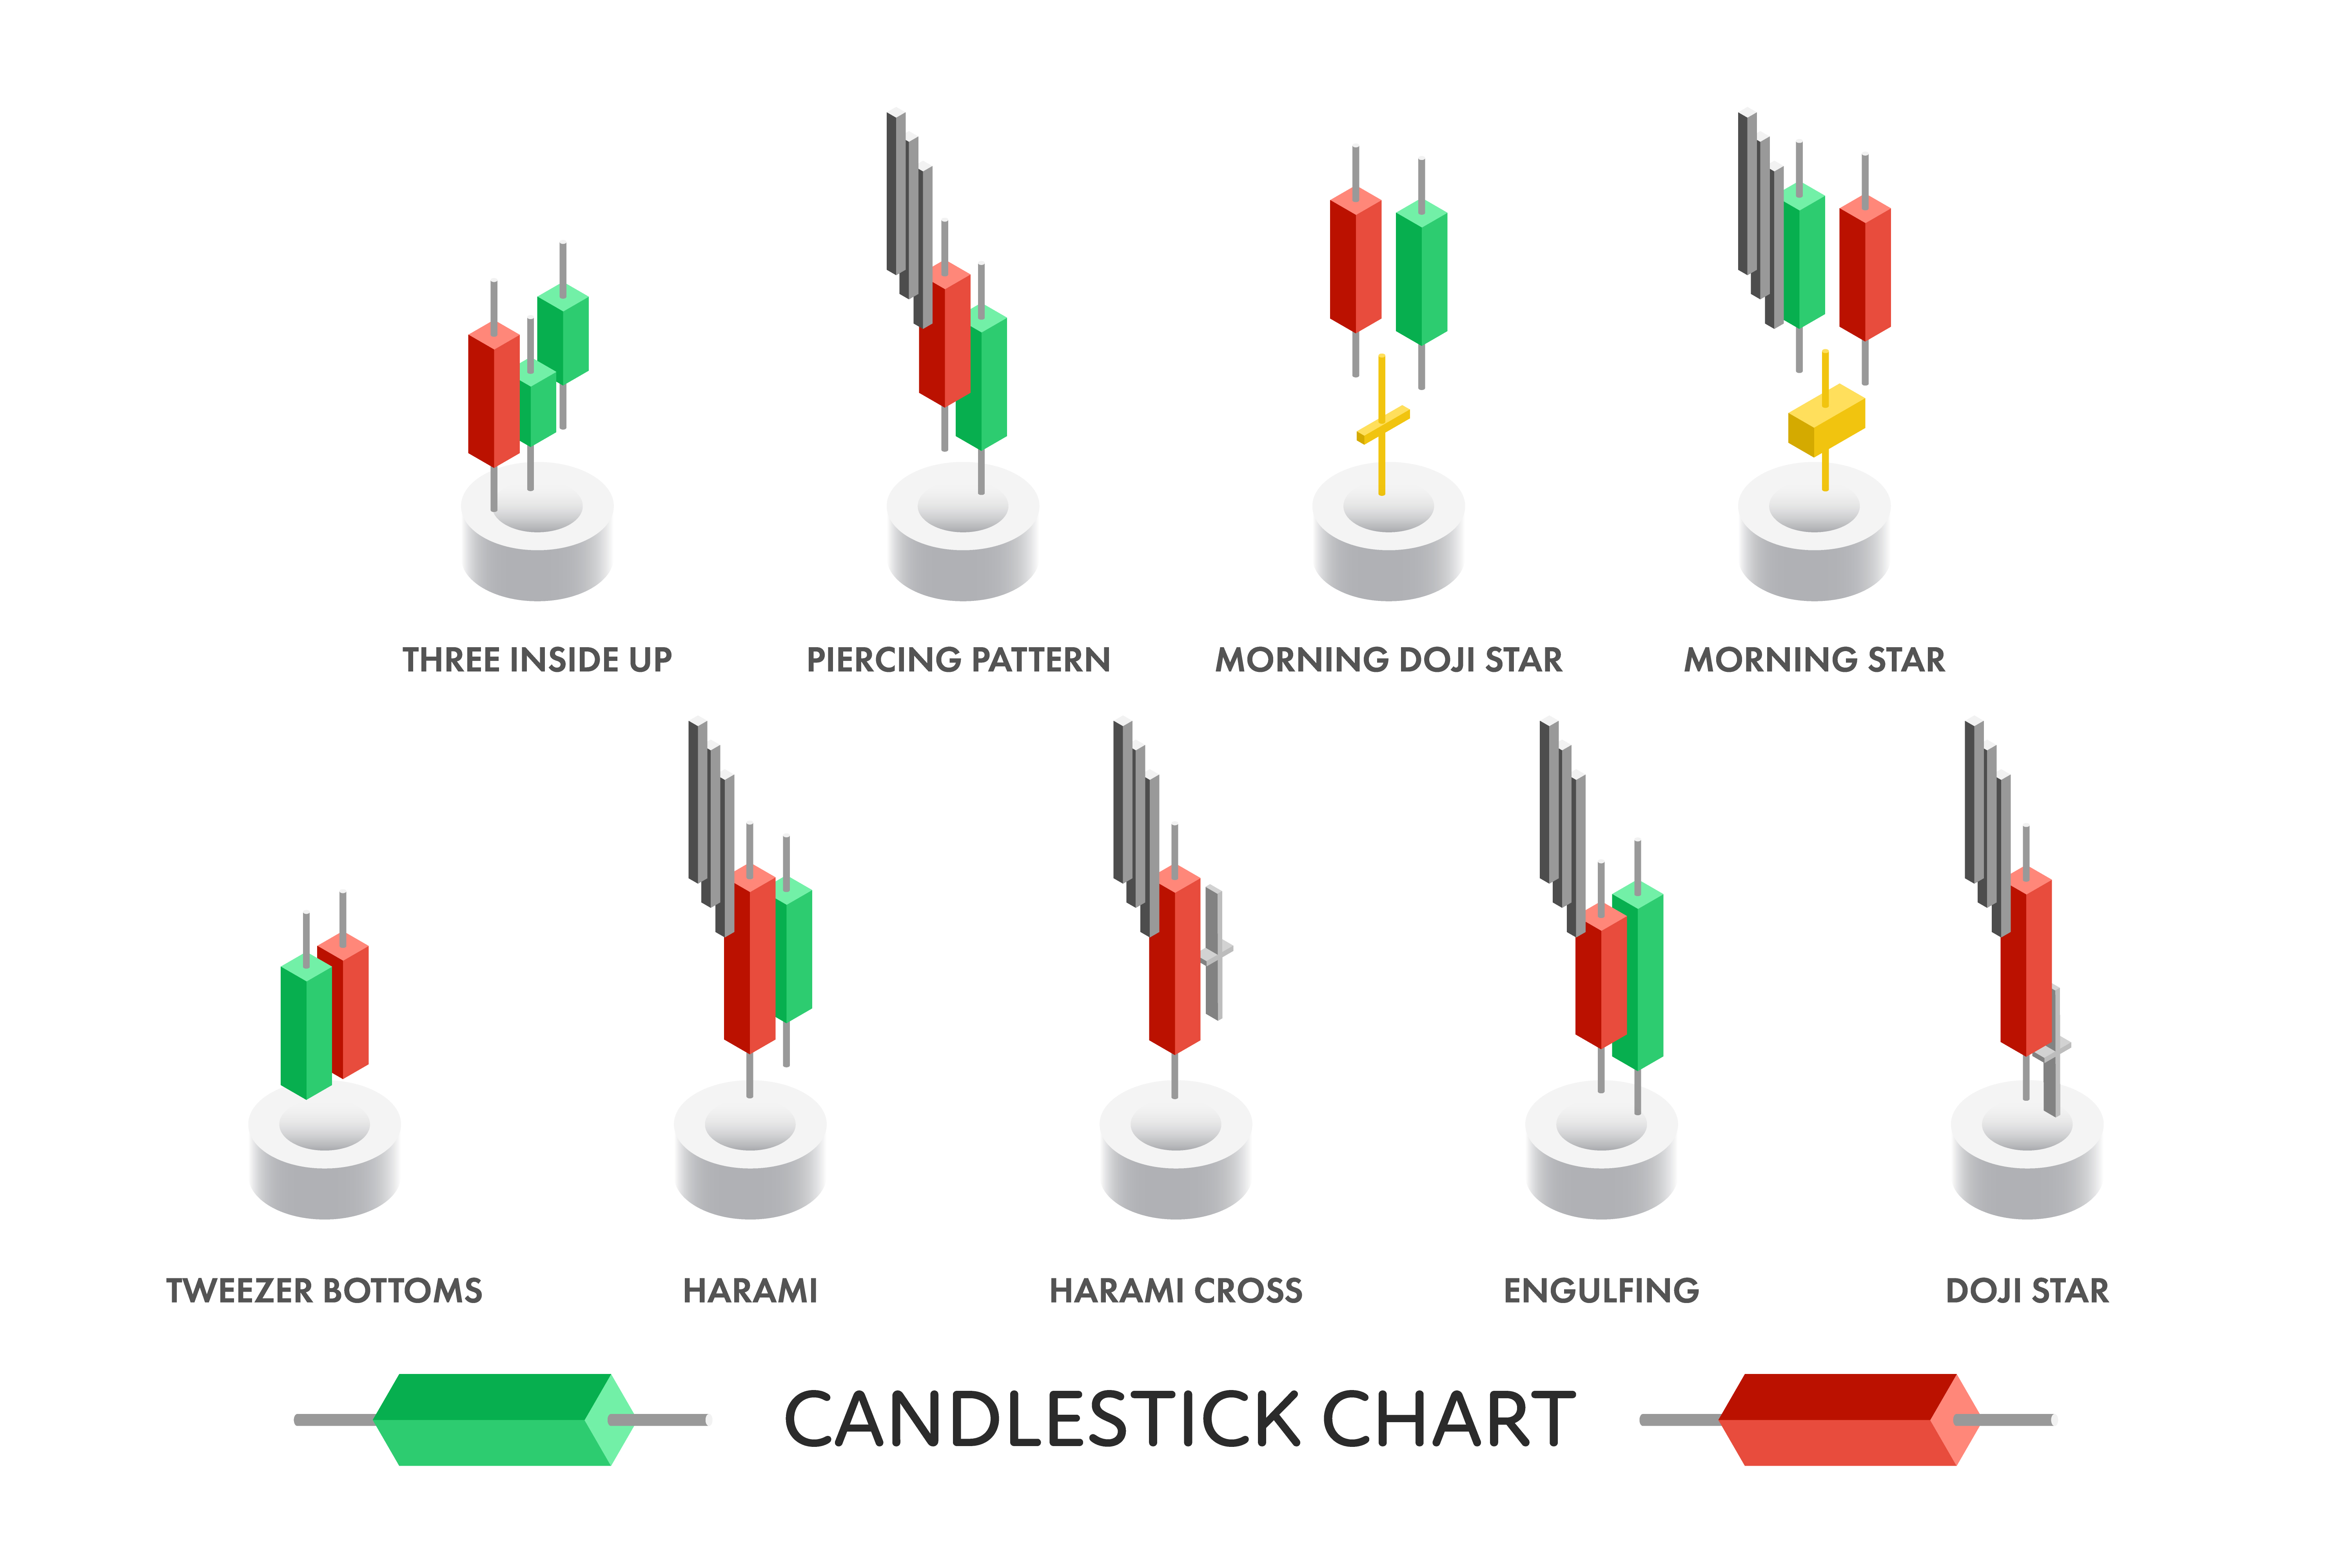
- Bullish Engulfing Pattern: A bullish engulfing pattern signals a reversal of a downtrend, as an up candle completely engulfs the prior down candle.
- Hammer Pattern: A hammer pattern signals a potential reversal near the bottom of a downtrend, characterized by a short body and a long, pointed wick below.
- Morning Star Pattern: A morning star pattern consists of three candles: a descending black candle, a small candlestick with a lower body, and a rising green candle closing above the prior day’s high.
Bearish Patterns: Omens of Descent and Caution
- Bearish Engulfing Pattern: A bearish engulfing pattern indicates a reversal of an uptrend, as a down candle completely engulfs the prior up candle.
- Hanging Man Pattern: A hanging man pattern signals a potential reversal near the top of an uptrend, characterized by a small body and a long, pointed wick below, similar to the hammer pattern.
- Evening Star Pattern: An evening star pattern comprises three candles: an ascending white candle, a small candlestick with a higher body, and a descending black candle closing below the prior day’s low.
Mastering Candlestick Patterns: A Guide to Strategic Implementation
While recognizing candlestick patterns is a valuable skill, true mastery lies in discerning their implications and leveraging them in trading strategies. The key lies in understanding the context in which the patterns emerge, considering factors such as overall market trends and volume.
When encountering a bullish pattern, such as a bullish engulfing or hammer pattern, traders may consider entering long positions or strengthening existing long positions. Bearish patterns, such as a bearish engulfing or hanging man pattern, may prompt traders to exit long positions or initiate short positions.
It is worth noting that while candlestick patterns provide valuable insights, they should not be used in isolation. Combining candlestick analysis with other technical indicators and market sentiment analysis can enhance the reliability and effectiveness of trading decisions.
Exploring the Nuances and Limitations of Candlestick Patterns
Despite their widespread popularity, candlestick patterns are not perfect and come with certain limitations. One notable limitation is that candlestick patterns are primarily based on historical price data, which may not always accurately predict future market behavior. Moreover, candlestick patterns can be subject to subjective interpretation, leaving room for varying opinions on their significance.
To mitigate these limitations, traders should employ a comprehensive approach to technical analysis, considering multiple factors and incorporating additional indicators to confirm signals.
Candle Stick Patterns
Conclusion: Illuminating the Path to Informed Trading Decisions
Candlestick patterns have proven their mettle as invaluable tools for navigating the complexities of markets. By deciphering the visual cues of candlestick formations, traders can gain a deeper understanding of market sentiment, identify potential turning points, and make more informed trading decisions.
While the mastery of candlestick patterns requires dedication and practice, the potential rewards are substantial. By incorporating candlestick analysis into their trading toolkit, traders can enhance their ability to trade with confidence and increase their chances of success in the ever-changing landscape of the markets.


