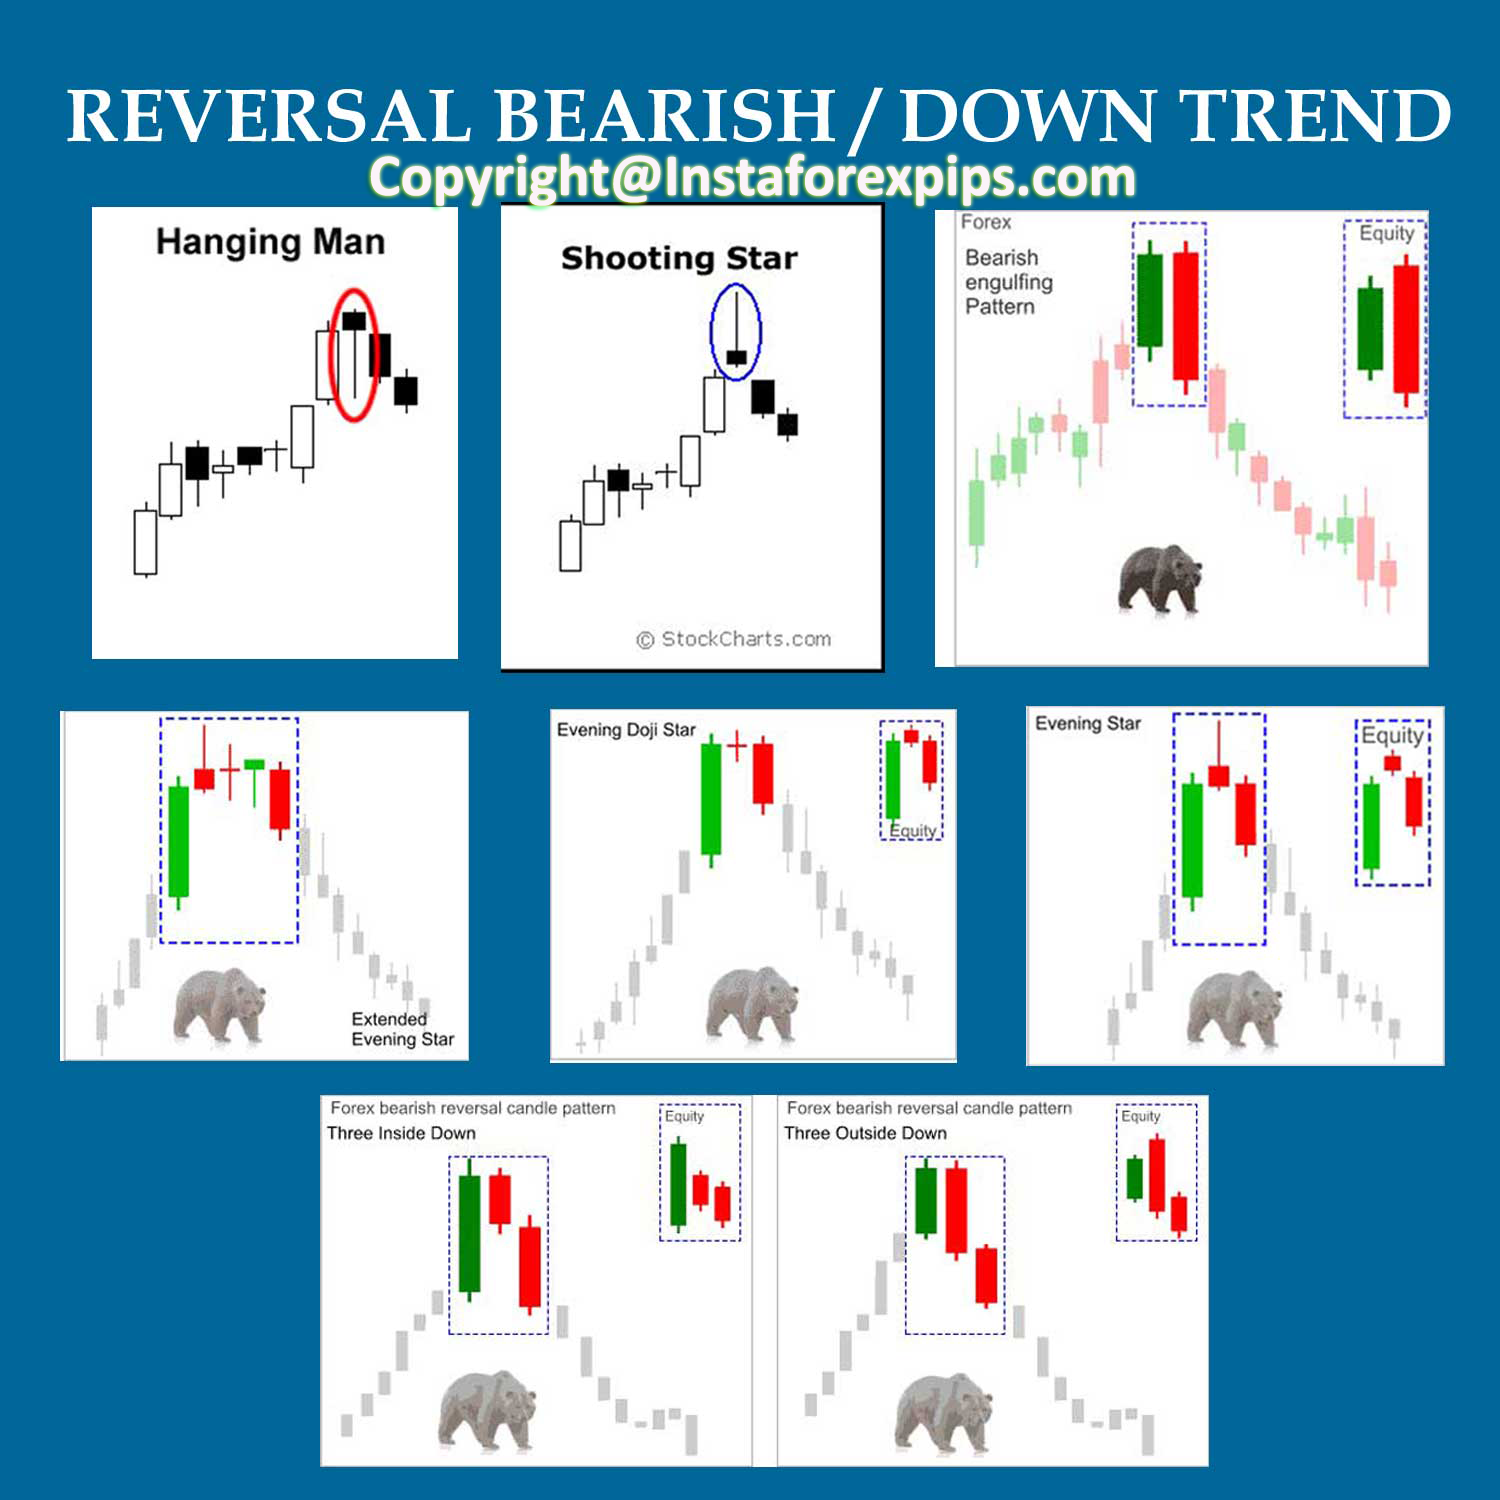
In the realm of technical analysis, candle stick charts reign supreme as a time-tested tool to decipher the hidden messages etched within price movements. These intricate formations of alternating colored candles, each representing a specific time frame, offer invaluable insights into market sentiment, helping traders and investors navigate the tumultuous waters of financial markets with greater confidence.

Image: instaforexpips.com
The genesis of candle stick charts can be traced back to the 18th century Japanese rice markets, where trader Munehisa Homma ingeniously devised these visual aids to predict future price movements. Centuries later, candle stick charts have become an indispensable element in the arsenal of modern traders, providing a window into the collective psychology driving market fluctuations.
Bullish Patterns: Harbingers of Hope in Price Ascendance
As day traders and short-term investors eagerly scan price charts, they seek telltale signs of market strength, and that’s where bullish candle stick patterns come into play. These formations, resembling celestial bodies rising in the trading firmament, signal an upswing in investor sentiment, fueling the anticipation of further price appreciation.
- Bullish Engulfing: A potent pattern signaling a reversal from downtrend to uptrend, marked by a small bearish candle fully engulfed by a subsequent bullish candle.
- Piercing Line: This pattern emerges when a bearish candle is pierced by a bullish candle whose body penetrates the midpoint of the prior candle’s range.
- Bullish Harami: A harbinger of bullish sentiment, taking its cue from a small bullish candle enclosed within the body of a larger bearish candle.
- Morning Star: A beacon of hope after a downtrend, featuring three candles: a large bearish candle, a small doji, and a bullish candle closing above the first candle.
- Three White Soldiers: A bullish trio of long-bodied bullish candles, each closing higher than the previous one, symbolizing a decisive upward trend.
Bearish Patterns: Cautionary Whispers in Price Declines
In the ebb and flow of market sentiment, bearish candle stick patterns emerge as prudent reminders of potential downturns. These patterns, mirroring the descent of celestial bodies on a star chart, serve as invaluable warning signals for investors seeking to mitigate risk and adjust their trading strategies accordingly.
- Bearish Engulfing: A harbinger of trouble, characterized by a small bullish candle entirely engulfed by a subsequent bearish candle.
- Dark Cloud Cover: Signaling a downturn, this pattern features a bullish candle followed by a bearish candle whose body completely engulfs the bullish candle.
- Bearish Harami: A bearish counterpart to its bullish cousin, this pattern consists of a small bearish candle encased within the body of a larger bullish candle.
- Evening Star: A portent of bearishness, formed by three candles: a large bullish candle, a small doji, and a bearish candle closing below the first candle.
- Three Black Crows: An ominous omen, this bearish brigade features three long-bodied bearish candles, each closing lower than the previous one, signaling a precipitous downtrend.
Extended Formations: Complex Patterns Unveiling Market Secrets
Beyond the classic patterns, candle stick charts offer a treasure trove of extended or continuation formations that provide deeper insights into market psychology. These intricate orchestrations of multiple candles, like intricate constellations in the night sky, unlock the hidden secrets of price action, empowering traders with an enhanced understanding of market dynamics.
- Bullish Rising Three Methods: A bullish flag emerges as the price consolidates within a bullish channel, followed by a breakout and continuation of the uptrend.
- Bearish Falling Three Methods: The bearish counterpart to the rising three methods, this pattern signals a potential downtrend continuation after consolidation.
- Bullish Three Inside Up/Down: A pattern composed of three inside candles and a potential breakout candle, signifying a reversal or continuation of the uptrend/downtrend.
- Bullish/Bearish Marubozu: These patterns denote extensive buying or selling pressure with open and close prices close to each other, indicating strong momentum.
- Up/Down Thrust: Marked by long shadows and a small body, these patterns signal a continuation of the prevailing trend.

Image: nl.pinterest.com
Candle Stick Chart Patterns
Conclusion: Unveiling the Power of Price Action
Candle stick chart patterns stand as a testament to the adage that history tends to repeat itself, even in the unpredictable world of financial markets. By embracing the wisdom embedded within these formations, traders and investors can gain an invaluable edge, fortifying their decision-making process with the insights gleaned from price action. Remember, the true power of candle stick charting lies not solely in pattern recognition but in the ability to interpret them in context, considering market trends and additional technical indicators. By unlocking the secrets hidden within these precio


