

Have you ever felt like the market was a raging ocean, tossing your trades around like driftwood? Do you long for a way to anticipate market turning points, to ride the waves of momentum, and to navigate the choppy waters of uncertainty? You’re not alone. Countless traders, both seasoned veterans and eager newcomers, search for an edge in this complex and evolving world. The good news is that there’s a valuable tool often employed by successful traders: Fibonacci retracements. This method, grounded in the fascinating mathematical series discovered by Leonardo Fibonacci, offers insights into market psychology and potential price reversals, providing a powerful tool for navigating the unpredictable world of trading.

Image: daytradingacademy.com
Fibonacci retracements are a technical analysis tool that uses specific mathematical ratios to identify potential support and resistance levels in financial markets. By applying these ratios, traders can anticipate price reversals and gain a better understanding of how the market is likely to behave. But what makes these seemingly simple ratios so significant? The story begins centuries ago, with Fibonacci’s groundbreaking work in mathematics, which has resonated throughout history, shaping everything from art and architecture to computer science and, yes, even financial markets.
The Golden Ratio: A Mathematical Secret with Financial Significance
Leonardo Fibonacci, a renowned 13th-century mathematician, unveiled a fascinating numerical sequence that has captivated minds for centuries. Known as the Fibonacci sequence, this series begins with 0 and 1, and each subsequent number is the sum of the two preceding ones: 0, 1, 1, 2, 3, 5, 8, 13, 21, and so on. This seemingly simple sequence holds a hidden key, a ratio known as the “Golden Ratio” or “Phi,” which is approximately 1.618. The Golden Ratio appears in nature, from the arrangement of seeds in a sunflower to the spiral of a seashell, and it has intriguing connections to art, architecture, and music.
But how does this ancient mathematical concept tie into the world of modern finance? The answer lies in the observation that financial markets, driven by human emotions and behavior, seem to exhibit patterns that resonate with the principles of the Fibonacci sequence. Prices tend to retrace a certain percentage of a previous move before continuing in the original direction. The Fibonacci ratios, derived from the Fibonacci sequence, such as 23.6%, 38.2%, 50%, 61.8%, and 100%, represent these retracement levels.
Navigating the Market with Fibonacci Retracements: A Trader’s Perspective
Imagine a price chart, a visual roadmap of the market’s journey. A sharp upward or downward move is often followed by a pullback, a pause in the trend. This pullback is where Fibonacci retracements come into play. Traders use these ratios to identify potential support and resistance levels where the price might reverse direction.
For instance, if a stock price rallies sharply, a retracement to a Fibonacci level like 38.2% of the previous move might signal a potential buying opportunity. Conversely, if the price falls sharply and then rebounds to 61.8% of the previous decline, it might indicate a potential selling opportunity.
These retracement levels are not guarantees, but they provide valuable insights into market psychology and possible turning points. They act as “early warning systems,” alerting traders to potential shifts in momentum. Experienced traders often use Fibonacci retracements in conjunction with other technical indicators to confirm their trading decisions.
Real-World Applications: From Stocks to Forex
Fibonacci retracements are a versatile tool that can be applied across a wide range of financial markets, including stocks, forex, commodities, and even cryptocurrencies. Let’s delve into some real-world examples:
-
Stocks: Imagine a stock like Apple experiencing a steep upward surge. A trader might use Fibonacci retracements to identify potential buying opportunities as the price retraces a certain percentage of that rally. Observing a retracement to the 38.2% level and seeing positive price action there might trigger a buy order.
-
Forex: In the volatile world of forex trading, Fibonacci retracements can assist in identifying potential reversals in currency pairs. A strong downward trend in EUR/USD, followed by a retracement to the 61.8% level, might be interpreted as a signal to short the currency pair.
-
Commodities: Commodities like gold and oil can experience significant price swings, often influenced by supply and demand factors. Using Fibonacci retracements to analyze price trends in these markets can aid traders in identifying potential entry and exit points.
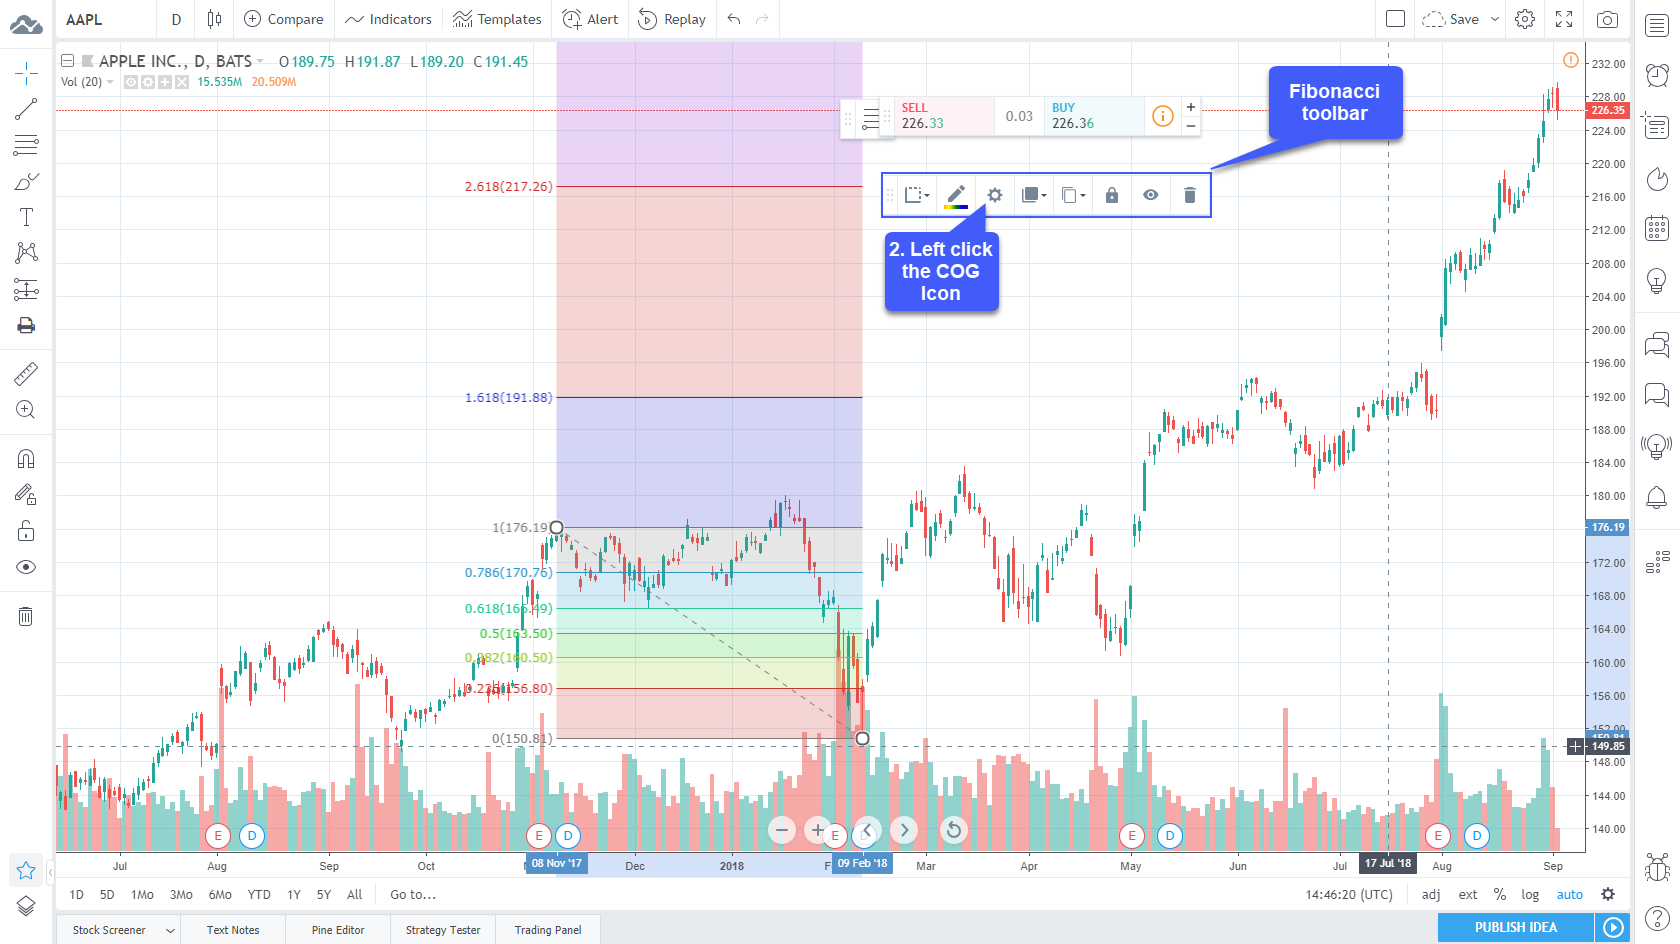
Image: community.optimusfutures.com
Expert Insights: Finding the Right Approach
While Fibonacci retracements can be a powerful tool, it’s crucial to remember that they are just one piece of the trading puzzle. Renowned financial expert, [Insert Name of Renowned Financial Expert], emphasizes the importance of combining technical analysis with fundamental analysis. “Fibonacci retracements provide valuable insights into market psychology, but a true understanding of the underlying fundamentals is equally important,” he states.
To grasp the full potential of Fibonacci retracements, traders should consider a few key factors:
-
Time Frame: Retracements work best on longer-term charts, where trends are more clearly defined. Shorter-term charts might reveal more erratic price movements, making it harder to rely solely on Fibonacci ratios.
-
Market Context: It’s essential to analyze the context of the market before applying Fibonacci retracements. Factors like economic news, geopolitical events, and market sentiment can influence price action.
-
Confirmation: Don’t rely on Fibonacci retracements alone; confirmation from other technical indicators is crucial. A combination of indicators can strengthen trading decisions.
Using Fib Retracements
The Power of Knowledge: Unleashing Your Trading Potential
By understanding the principles of Fibonacci retracements, you arm yourself with a powerful tool for navigating the complexities of financial markets. These ratios provide insights into market sentiment and potential turning points, offering a glimpse into the future direction of price movements.
Remember, Fibonacci retracements are not a magic bullet; they are just one of many tools available to traders. Continuously learning and honing your trading skills, combining technical analysis with a thorough understanding of the markets, is the key to achieving success.
Take the first step on your journey to becoming a more informed and successful trader. Explore Fibonacci retracements and discover how this ancient mathematical concept can unlock new possibilities in your trading endeavors. May your journey be filled with profitable trades and insightful discoveries!


