

The world of finance is a complex and constantly evolving one. As a trader, you’re always looking for an edge – a way to identify potential market movements before they happen. And in this quest, a powerful tool often comes into play: the Fibonacci retracement.

Image: top10stockbroker.com
I remember the first time I encountered Fibonacci retracements. I was a young trader, just starting out, trying to navigate the volatile world of the stock market. I was overwhelmed by the sheer amount of data and information – price charts, indicators, and news headlines seemed to be bombarding me from all sides. Then, I stumbled upon this peculiar sequence of numbers that seemed to hold the key to predicting future price movements. It seemed almost magical, and I knew I had to learn more.
Understanding Fibonacci Retracements
What are Fibonacci Retracements?
Fibonacci retracements are a technical analysis tool used by traders to identify potential support and resistance levels in a financial market. They are based on the Fibonacci sequence, a mathematical sequence where each number is the sum of the two preceding numbers: 0, 1, 1, 2, 3, 5, 8, 13, 21, and so on.
This sequence appears in nature, in the arrangement of leaves on a branch, the spiral shells of a nautilus, and even in the human body. In finance, the Fibonacci sequence is used to derive a set of ratios: 0.0%, 23.6%, 38.2%, 50.0%, 61.8%, 100.0% and 161.8%.
How do Fibonacci Retracements Work?
These ratios are then applied to a price chart to identify potential reversal points. Traders draw horizontal lines across the chart, representing the Fibonacci levels. When the price of an asset retraces from a high or low, it’s believed that these specific Fibonacci levels will act as support or resistance, potentially triggering a reversal in the trend.
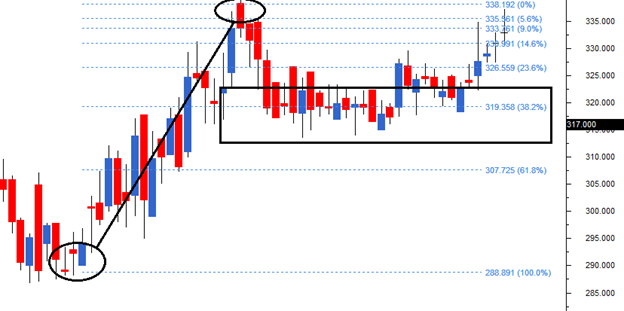
Image: lindaufiber.innoxess.es
Using Fibonacci Retracements in Trading
Identifying Support and Resistance Levels
The primary application of Fibonacci retracements is to identify potential support and resistance levels. When a price is trending upwards and then begins to retrace, traders might look for the price to find support at one of the Fibonacci retracement levels, like the 38.2% or 61.8% level. Conversely, when a price is trending downwards and retraces upward, traders may expect resistance at these same Fibonacci levels.
Confirming Trend Reversals
Fibonacci retracements can also be used to confirm trend reversals. If a price retraces to a Fibonacci level and bounces off of it, it can indicate a strong potential for the trend to resume. This bounce might be accompanied by other indicators such as increased trading volume or momentum, further strengthening the signal.
Setting Stop-Loss and Take-Profit Levels
Fibonacci retracements are frequently used for setting stop-loss and take-profit levels. Traders can place their stop-loss orders just below a key Fibonacci level, mitigating potential losses during a sudden price drop. Similarly, take-profit orders can be positioned above a Fibonacci level, aiming to capture a significant portion of the potential price swing.
Understanding the limitations
While Fibonacci retracements can be a powerful tool, it’s crucial to understand their limitations. These levels are not foolproof predictions, and they shouldn’t be used in isolation. Market conditions and other factors can influence price movements, making it vital to consider other technical indicators and fundamental analysis alongside Fibonacci retracements for a well-rounded trading strategy.
Integrating Fibonacci Retracements with Other Indicators
The strength of Fibonacci retracements lies in their ability to be combined with other technical analysis indicators. For example, traders might use moving averages to confirm the trend, MACD to assess momentum, and Bollinger bands to gauge volatility. Such an integrated approach can provide a more comprehensive view of the market and improve the accuracy of trading decisions.
Tips for Effective Use of Fibonacci Retracements
Here are some tips to maximize your use of Fibonacci retracements in your trading strategy:
- Choose the Right Time Frame: Fibonacci retracements work better on larger timeframes, such as daily or weekly charts, as they capture the bigger trends and provide more reliable signals.
- Identify Clear Trends: Fibonacci retracements are most effective when used in established trends. Use trend-following indicators, such as moving averages, to confirm the direction of the trend.
- Look for Confirmation: Don’t rely solely on Fibonacci retracements to make trading decisions. Combine them with other technical indicators and chart patterns for confirmation.
- Adjust Your Strategy: Market conditions can change, so be prepared to adjust your strategy accordingly. Don’t blindly follow Fibonacci levels. Use them as a guide in conjunction with your overall trading plan.
- Manage Your Risk: Always use stop-loss orders to limit potential losses. Take-profit levels can also be set to lock in profits when a price reaches a specific Fibonacci level.
- Practice and Experiment: The best way to learn how to use Fibonacci retracements effectively is through practice and experimentation. Backtest your strategies on historical data and refine your approach based on your findings.
Frequently Asked Questions
What are the most important Fibonacci retracement levels?
The most commonly used Fibonacci retracement levels are 23.6%, 38.2%, 50.0%, and 61.8%. However, the 161.8% extension level is also frequently used to identify potential targets for further price movements.
How do I draw Fibonacci retracements on a chart?
You can draw Fibonacci retracements using most charting software. Simply select the tool, identify the high and low points of the retracement, and the software will automatically draw the levels for you. It is essential to understand the fundamentals of drawing and applying them to your specific trading strategy.
Can I use Fibonacci retracements for all trading styles?
Fibonacci retracements are versatile tools and can be used in various trading styles. However, they are more relevant for trend-following strategies and may not be as effective in choppy or range-bound markets.
Are Fibonacci retracements a guaranteed trading strategy?
No, Fibonacci retracements are not a guaranteed trading strategy. No method can predict the market with 100% accuracy. Fibonacci retracements are a tool to be used in conjunction with other strategies and to help inform trading decisions.
How Do You Use Fibonacci Retracement
https://youtube.com/watch?v=3Bh_5iUkZuk
Conclusion
Fibonacci retracements can be a valuable tool for traders looking to identify potential support and resistance levels, confirm trend reversals, and set stop-loss and take-profit orders. However, it is crucial to use them in conjunction with other technical indicators and fundamental analysis. Don’t rely solely on them for trading decisions. Always manage your risk, adjust your strategy as needed, and practice and experiment to refine your approach.
Are you interested in learning more about using Fibonacci retracements for your trading endeavors? Share your thoughts and questions in the comments below. Let’s continue the dialogue and delve deeper into this fascinating concept.


