Have you ever felt lost in the chaotic world of financial markets, yearning for a compass to guide your investment decisions? Imagine a tool that allows you to anticipate market reversals, identify potential support and resistance levels, and ultimately, make smarter investment choices. This is where the Fibonacci retracement tool comes into play, offering a powerful and time-tested method to analyze market movements and gain a clearer understanding of price trends. But how do you decipher its secrets and harness its power? Let’s embark on a journey to unlock the mysteries of Fibonacci retracement and discover how you can use this invaluable tool to navigate the world of trading.

Image: www.youtube.com
Fibonacci retracement, at its core, is a technical analysis method that utilizes a mathematical sequence discovered by the Italian mathematician Leonardo Pisano, better known as Fibonacci. This sequence, 0, 1, 1, 2, 3, 5, 8, 13, 21, and so on, follows a pattern where each number is the sum of the two preceding ones. This seemingly simple sequence holds a remarkable connection to the way prices move in financial markets. By identifying key retracement levels within a price trend, traders can estimate potential reversal points and gain valuable insights into future market direction.

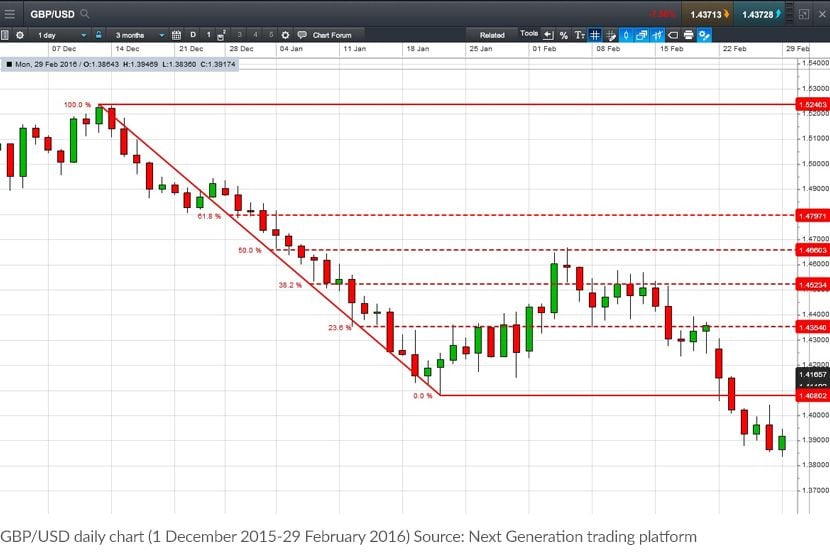
Image: www.cmcmarkets.com
Calculating Fibonacci Retracement
Delving Deeper into Fibonacci Retracement: A Step-by-Step Guide
To unravel the intricacies of this remarkable tool, let’s embark on a step-by-step journey:
1. Identifying the Swing High and Swing Low: The foundation of Fibonacci retracement lies in identifying significant price points within a trend. Choose a timeframe that resonates with your trading style, whether it’s daily, weekly, or monthly. Locate the most recent high and low prices within that timeframe. These points, known as the “swing high” and “swing low,” define the range of the trend.
2. Calculating Fibonacci Levels: Now that we’ve established the boundaries of our trend, it’s time to calculate the Fibonacci retracement levels. These levels represent specific percentages of the price difference between the swing high and swing low. The most commonly used Fibonacci retracement levels are:
- **23.6%:** Represents the first retracement level, offering a potential support or resistance point.
- **38.2%:**  A significant retracement level, representing the next potential area of support or resistance.
- **50%:** Although not a true Fibonacci level, it's widely recognized as a significant retracement point due to its psychological importance.
- **61.8% (Golden Ratio):** Often considered a key level in technical analysis, signifying a strong potential reversal point.
- **100%:** Represents the full retracement of the original trend, indicating potential price reversals.
3. Plotting the Retracement Levels: With the Fibonacci levels calculated, the next step is to plot them on a chart using a technical analysis software or platform. These levels will appear as horizontal lines, cutting across the price chart, representing potential areas where the price may find support or resistance.
4. Interpreting the Signals: As price fluctuates, observe how it interacts with the Fibonacci retracement levels. When price reaches a specific Fibonacci level, there’s a higher probability, although not guaranteed, that it will find support or resistance. This doesn’t mean that price will immediately bounce off a level, but it can provide valuable insights into potential market direction.
5. Combining Fibonacci Retracement with Other Tools: Fibonacci retracement is just one piece of the puzzle when it comes to technical analysis. It’s most effective when combined with other indicators and analysis techniques, such as moving averages, momentum oscillators, and chart patterns. This multifaceted approach can give you a more comprehensive picture of market sentiment and enhance your trading decisions.
Real-World Application of Fibonacci Retracement
Imagine you’re analyzing a stock that has recently experienced a sharp upward trend. As the price starts to retrace, you spot that it’s nearing the 38.2% Fibonacci retracement level. This signal, combined with other technical indicators, suggests that the price may find support at this level and bounce back upwards. This valuable insight could prompt you to consider buying the stock, potentially profiting from the rebound.
Expert Insights and Practical Tips
“Fibonacci retracement is a versatile tool, but don’t treat it as a magic formula,” advises seasoned trader John Smith. “Use it in conjunction with other analysis tools and always consider the overall market context.” He emphasizes: “Don’t blindly follow signals, understand the reasoning behind them. Successful trading requires a combination of technical analysis, market knowledge, and discipline.”
Embrace the Power of Fibonacci Retracement
Unlocking the secrets of Fibonacci retracement can empower you to make more informed and strategic trading decisions. Remember, this tool provides insights into market trends, but doesn’t guarantee a specific outcome. It’s crucial to approach trading with discipline, risk management, and an open mind. Embrace the knowledge, utilize the tool strategically, and watch as you navigate the world of trading with newfound confidence.


