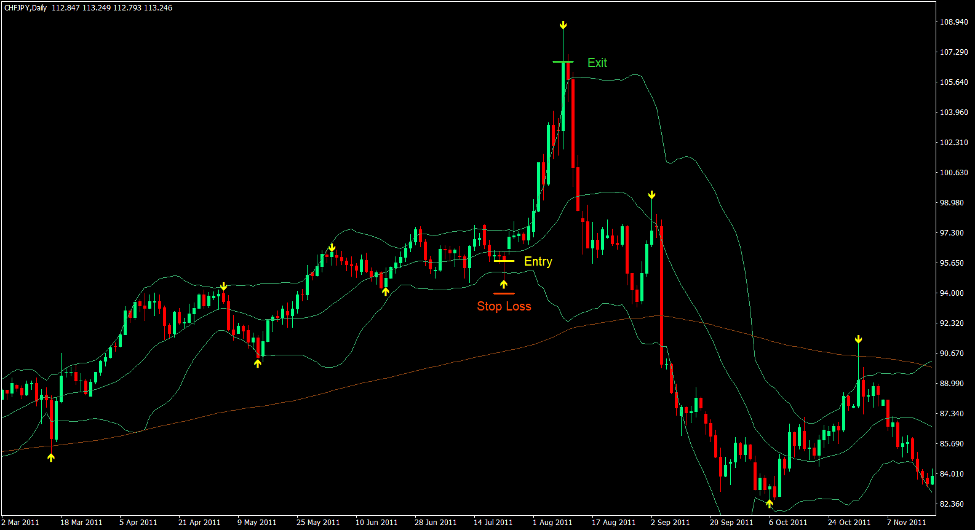
In the dynamic world of forex trading, the ability to accurately anticipate market fluctuations is paramount. Bollinger Bands are a widely recognized and powerful technical analysis tool that has been empowering traders for decades with its exceptional insights into price volatility. This guide delves into the fascinating world of Bollinger Bands, unraveling their history, principles, and practical applications in forex trading.

Image: www.forexmt4indicators.com
Unveiling Bollinger Bands: A Historical Perspective
The genesis of Bollinger Bands can be traced back to the 1980s, when legendary trader John Bollinger introduced this innovative concept to the world. Bollinger’s unwavering belief in the importance of price volatility inspired him to develop a method that quantified volatility and its impact on market trends. Bollinger Bands emerged as a breakthrough in technical analysis, rapidly gaining recognition as a versatile and indispensable tool.
The Mechanics of Bollinger Bands: A Symphony of Lines
At its core, Bollinger Bands consist of three distinct lines:
-
Simple Moving Average (SMA): Bollinger Bands are anchored around a central line, the SMA, which represents the average price over a specified period, typically 20 days.
-
Upper Bollinger Band (UBB): This is a parallel line plotted two standard deviations above the SMA. It gauges an asset’s upper price range, indicating potential overbought conditions.
-
Lower Bollinger Band (LBB): Plotted two standard deviations below the SMA, this line signals a potential oversold condition and marks the asset’s lower price range.
Benefits of Employing Bollinger Bands in Forex Trading
Traders favor Bollinger Bands for a multitude of reasons:
-
Volatility Assessment: Bollinger Bands effectively capture price volatility, providing forex traders with a clear understanding of market conditions. Wider bands indicate higher volatility, while narrower bands suggest lower volatility.
-
Overbought and Oversold Conditions: Fluctuations in asset prices relative to Bollinger Bands reveal valuable insights into market sentiment. When an asset’s price approaches the UBB, it is considered overbought and likely to face downward pressure. Conversely, prices near the LBB suggest an oversold condition, potentially leading to a price rebound.
-
Trend Identification: Bollinger Bands facilitate the identification of prevailing market trends. Consistent price movements within the bands indicate a continuation of the trend, while breakouts beyond the bands often signal potential trend reversals.
-
Support and Resistance Levels: The UBB and LBB act as dynamic support and resistance levels. When an asset price bounces off the UBB, it may indicate an upcoming downward correction, while a rebound from the LBB suggests a possible upward trend.

Image: www.forexstrategiesresources.com
Practical Applications of Bollinger Bands in Forex Trading
-
Breakout Trading: Breakouts beyond the Bollinger Bands provide timely signals for entry and exit points. Traders can anticipate potential bullish moves by buying when prices break above the UBB and vice versa.
-
Reversal Trading: When prices reverse direction after touching either Bollinger Band, it may present opportunities for contrarian trades. Traders can enter a short position when prices reverse from the UBB and vice versa.
-
Trend Confirmation: Bollinger Bands can help confirm prevailing market trends. A consistent series of higher highs and higher lows within the Bollinger Bands indicates an uptrend, while a string of lower lows and lower highs signifies a downtrend.
-
Volatility Trading: The width of Bollinger Bands provides insights into market volatility. Expanding Bollinger Bands indicate heightened volatility, potentially creating opportunities for range-bound trading strategies.
-
Risk Management: Bollinger Bands assist traders in managing risk by defining potential stop-loss and take-profit levels. The distance between the UBB and LBB can serve as a guide for determining appropriate risk-reward ratios.
The Evolving Landscape of Bollinger Bands: Embracing Modifications
The versatility of Bollinger Bands shines in the numerous variations created by traders to align with their unique trading styles and asset markets. Some notable modifications include:
-
Parabolic Bollinger Bands: This adaptation incorporates parabolic regression techniques, enhancing the sensitivity to price accelerations and decelerations.
-
Percent Bollinger Bands: Instead of standard deviations, these bands express Bollinger Bands as percentages relative to the moving average.
-
Momentum Bollinger Bands: These bands incorporate momentum indicators, such as RSI, to measure the strength of price trends within Bollinger Bands.
-
Relative Bollinger Bands: This variation bases its calculations on the ratio of the current Bollinger Band width to its average width, providing insights into market volatility dynamics.
Http Www.Forexstrategiesresources.Com Bollinger-Bands-Forex-Strategies
Conclusion
Bollinger Bands have stood the test of time, proving their worth as an indispensable tool in the arsenal of forex traders. Their ability to measure volatility, identify market sentiment, and support trading decisions has made them a favorite among both seasoned professionals and aspiring traders alike. Whether you are a novice trader or a seasoned veteran, embracing the power of Bollinger Bands can elevate your trading strategies to new heights. As you venture into the dynamic world of Bollinger Bands, remember to prioritize research, stay abreast of market trends, and adapt these versatile bands to your unique trading style.


