

The stock market can be a dizzying world, with prices constantly fluctuating. As a trader, you’re always seeking ways to predict price movements and make profitable trades. One such tool that has stood the test of time is Fibonacci Retracement. A few years ago, I was struggling to find a reliable method to identify potential support and resistance levels in a volatile market. Then I stumbled upon Fibonacci Retracement, which quite literally changed the way I approached trading.

Image: dzengi.com
While it may seem like some mystical concept, Fibonacci Retracement is a powerful, data-driven technique that helps traders identify potential price reversal points. This method has been utilized by traders for decades and continues to be a valuable tool in the modern trading landscape. Let’s delve deeper into understanding how this technique works and how you can leverage it for trading success.
Unraveling the Magic of Fibonacci Retracement
The Fibonacci Sequence: The Foundation of the Tool
At the heart of Fibonacci Retracement lies the Fibonacci sequence. This sequence, discovered by the Italian mathematician Leonardo Pisano, known as Fibonacci, is a series of numbers where each number is the sum of the two preceding ones. The sequence begins with 0 and 1: 0, 1, 1, 2, 3, 5, 8, 13, 21, 34, and so on.
The Golden Ratio: Connecting Mathematics and Markets
Within the Fibonacci sequence, a fascinating ratio emerges, often referred to as the Golden Ratio. This ratio, approximately 1.618, is found throughout nature, art, and even financial markets. In the context of Fibonacci Retracement, this Golden Ratio is represented as 61.8% and plays a crucial role in identifying potential support and resistance levels.
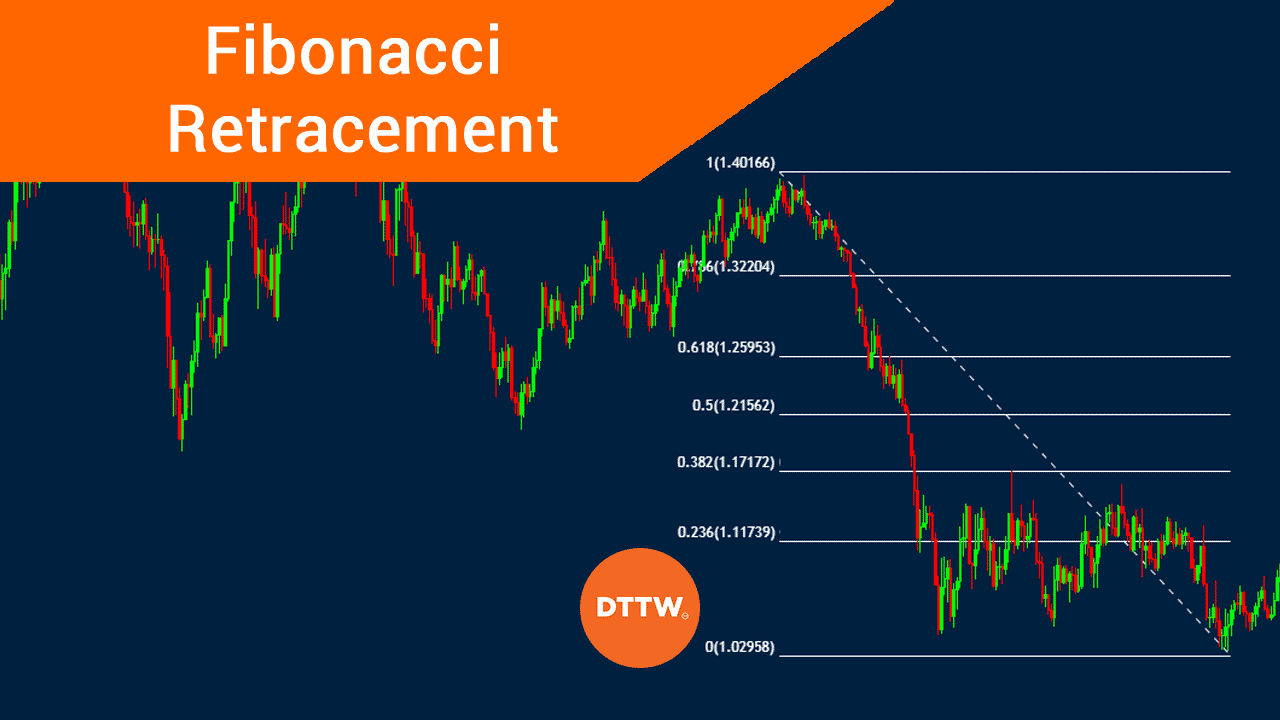
Image: www.daytradetheworld.com
Applying Fibonacci Retracement: A Step-by-Step Guide
1. **Identify a Trend:** The first step is to identify a clear upward or downward trend in the price chart. This could be a recent uptrend or a downtrend.
2. **Define the Swing High and Swing Low:** Once you’ve identified the trend, you need to find the highest high (swing high) and the lowest low (swing low) within that trend.
3. **Draw the Fibonacci Levels:** Now, use a Fibonacci retracement tool, available on most trading platforms, to connect the swing high and swing low. This tool will automatically generate Fibonacci retracement levels at specific percentages: 23.6%, 38.2%, 50%, 61.8%, and 100%.
4. **Interpret the Levels:** The Fibonacci levels represent potential support and resistance levels. During a downtrend, prices tend to bounce off these levels, while in an uptrend, they can act as resistance points where the price may stall or reverse.
5. **Combine with Other Technical Indicators:** Fibonacci retracement is a powerful tool, but it’s also best used in tandem with other technical indicators, such as moving averages, MACD, or RSI, to confirm potential reversal points and trading setups.
Beyond the Basics: Refining Your Fibonacci Approach
Understanding the Significance of Each Level
While all Fibonacci levels are important, some hold more significance than others. The 61.8% level, representing the Golden Ratio, is often a key level for reversals. The 38.2% level is also a significant level, often acting as a support or resistance level, while the 50% level is a natural midpoint and can also be important for price action.
Beyond the Classical Levels: Expanding Your Toolkit
Beyond the standard 23.6%, 38.2%, 50%, 61.8%, and 100% levels, additional retracement levels like 1.272 and 1.618 (extensions of the Golden Ratio) can be utilized to identify potential price targets after a retracement. These extensions can be particularly useful for identifying areas where a price could move following a retracement.
Tips for Using Fibonacci Retracement Effectively
First and foremost, remember that Fibonacci Retracement is not a crystal ball. It’s a tool that helps provide potential support and resistance levels, but it’s essential to use it in conjunction with other indicators and sound trading strategies.
Secondly, context is vital. Always consider the broader market conditions, the specific asset you’re trading, and the overall trend before relying solely on Fibonacci levels. Additionally, don’t be afraid to experiment and test different levels, combining them with other technical indicators to discover which combination works best for you.
Fibonacci Retracement: A Versatile Tool for Technical Analysis
Fibonacci Retracement is a valuable tool that can help you navigate the complex world of financial markets. By understanding the Fibonacci sequence, the Golden Ratio, and how to apply Fibonacci levels effectively, you can gain a deeper insight into potential price reversals and trading opportunities.
Frequently Asked Questions
Q: How accurate is Fibonacci Retracement?
A: Fibonacci retracement is not a guarantee, but a tool that can help identify potential areas of support and resistance. Its accuracy depends on various factors, including market conditions, asset volatility, and the time frame being analyzed.
Q: What are some of the limitations of utilizing Fibonacci Retracement?
A: As a technical analysis tool, it doesn’t account for fundamental factors that can influence price movements. Additionally, the levels can be subjective and subject to interpretation, requiring traders to integrate them with other indicators and strategies for accurate analysis.
Q: Can I use Fibonacci Retracement in any market?
A: While it’s commonly used in stock markets, Fibonacci Retracement can be applied to various markets, including forex, commodities, and cryptocurrencies. However, it’s important to understand the specific characteristics of each market before applying this tool.
How To Use Fibonacci Retracement
Conclusion
Fibonacci Retracement, based on the fascinating Fibonacci sequence, is a powerful tool that can help you enhance your technical analysis. It provides potential support and resistance levels, aiding in identifying potential price reversals. However, remember to use it alongside other indicators and strategies, always considering the broader market context before making trading decisions.
Are you interested in learning more about Fibonacci retracement and how it can be used in your trading strategies?


