Imagine yourself navigating the tumultuous sea of financial markets, armed with an arsenal of knowledge that empowers you to conquer any challenge. In this comprehensive guide, we will embark on an enlightening journey to unravel the mysteries of candlesticks, the powerful navigational tool that traders rely on to unravel market dynamics and make informed decisions.

Image: www.dailyfx.com
Candle charting holds a profound significance in the world of trading. These chart formations serve as visual representations of price action over specific time intervals, enabling traders to grasp crucial market sentiment and derive valuable insights. Candle patterns are not mere embellishments; they are analytical tools that hold the key to grasping market trends, predicting reversals, and boosting trading outcomes.
Candlestick Anatomy: Deciphering the Visual Language of Markets
A candlestick, at its core, is composed of a rectangular body and potentially two wicks, one extending above and one below. The body represents the price range between the opening and closing prices during the specified time frame, while the wicks indicate the highs and lows achieved within that period.
The interpretation of candlesticks goes beyond their basic structure. The interplay of colors also plays a pivotal role. Typically, a green or white candle denotes an upwards trend, indicating that the closing price exceeded the opening price. Conversely, a red or black candle signifies a downwards trend, signaling that the closing price fell beneath the opening price.
Candle Patterns: A Kaleidoscope of Market Sentiments
Candlesticks, like artistic brushstrokes on a canvas, weave intricate patterns that convey a wealth of information about market sentiment. These patterns, formed by the unique interplay of shape and color, offer valuable insights into price dynamics and potential future market trajectories.
Some of the most commonly encountered and significant candlestick patterns include:
- Bullish Candles:
- Bullish Engulfing: Occurs when a green candle completely engulfs the preceding red candle, showcasing a shift in market dominance towards the bulls.
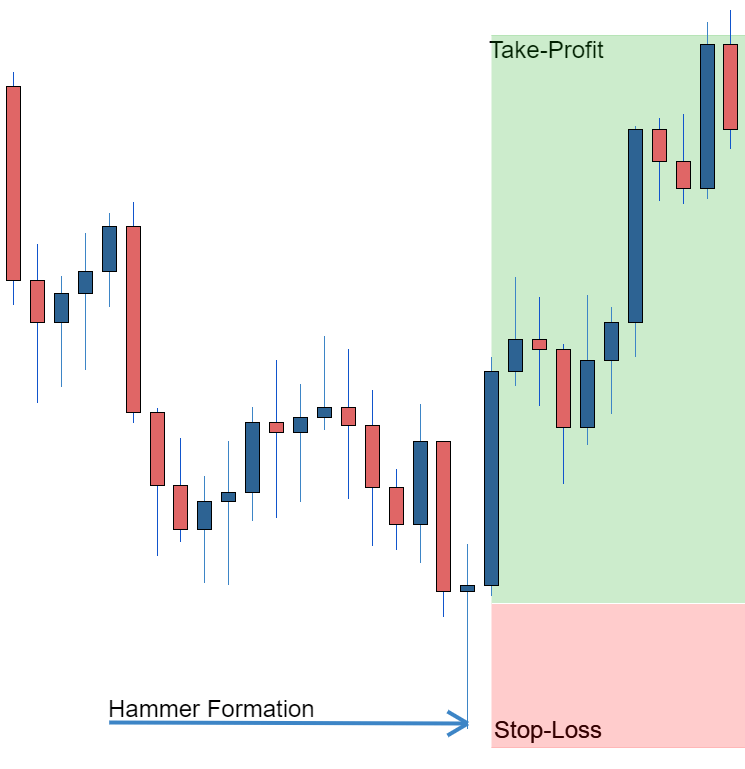
- Hammer: A green candle with a small body and a long lower wick, signaling a potential bullish reversal after a downtrend.
- Piercing Line: A long green candle that closes above the midpoint of the previous day’s range, indicating a shift from bearish to bullish momentum.
- Bearish Candles:
- Bearish Engulfing: A red candle that completely engulfs the preceding green candle, signaling a shift in market control towards the bears.
- Hanging Man: A red candle with a small body and a long upper wick, indicating a potential bearish reversal after an uptrend.
- Dark Cloud Cover: A red candle that opens above the previous day’s close and closes near its low, suggesting a shift from bullish to bearish sentiment.
Candlestick Trading Strategies: Navigating Market Tides with Precision
By mastering the art of candlestick interpretation, traders gain a competitive edge in navigating the ever-changing landscape of financial markets. Numerous effective trading strategies revolve around candlestick patterns, enabling traders to capitalize on market trends and make informed decisions.
One such strategy is the Pinocchio Bar Reversal. When a candle forms a long wick on one side and a short body on the other, it’s known as a Pinocchio Bar. If this pattern appears at the end of a trend, it signals a potential reversal.
Another popular technique is Trading with Inside Bars. Inside bars form when a candle’s range is contained entirely within the range of the previous candle. This pattern often indicates a period of consolidation or indecision in the market. Traders may choose to enter or exit trades based on the breakout from the inside bar’s range.

Image: www.vecteezy.com
Candlestick Is For Stock Or Forex
Conclusion: Empowering Traders with the Wisdom of Candlesticks
Candlesticks, like skilled artisans, paint a vivid picture of market sentiment, enabling traders to decipher its complex tapestry. Through diligent study and practice, traders can harness the power of candle patterns to gain a deeper understanding of price dynamics, predict reversals, and execute trades with greater precision. Whether you’re an experienced trader or just starting your journey in the financial markets, embracing the knowledge of candlesticks unlocks a realm of possibilities, empowering you to navigate market tides with confidence and reap the rewards of successful trading.


