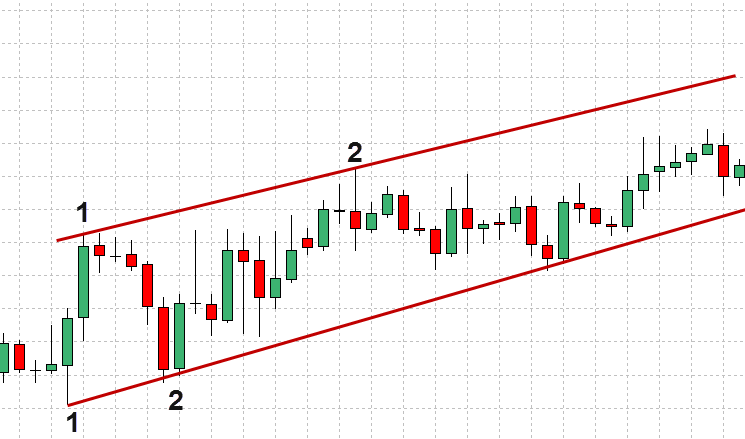
Forex trading is a complex and volatile field, but mastering a few key concepts can help you make more informed decisions and increase your chances of profitability. One of the most fundamental concepts in technical analysis is the trend line. A trend line is a line that connects two or more price points on a chart, and it can be used to identify the overall direction of a currency pair’s movement.

Image: www.forexmt4indicators.com
Trend lines are a versatile tool that can be used by traders of all levels of experience. They can be used to identify trading opportunities, determine stop-loss and take-profit levels, and manage risk. In this article, we will take a closer look at trend lines and how to use them to improve your forex trading strategy.
What is a Trend Line?
A trend line is a line that connects two or more price points on a chart. The most common type of trend line is a linear trend line, which is a straight line that connects two price points. However, trend lines can also be parabolic or logarithmic, depending on the shape of the price movement.
Trend lines are used to identify the overall direction of a currency pair’s movement. An uptrend is indicated by a rising trend line, while a downtrend is indicated by a falling trend line. Trend lines can also be used to identify periods of consolidation or sideways movement.
How to Draw Trend Lines
Drawing trend lines is a simple process, but it is important to do it correctly. To draw a trend line, you will need to connect two or more price points on a chart. The price points should be significant, such as swing highs or lows.
The line should be angled in such a way that it touches as many price points as possible without intersecting any other price points. The longer the trend line, the more significant it is.
Identifying Trading Opportunities
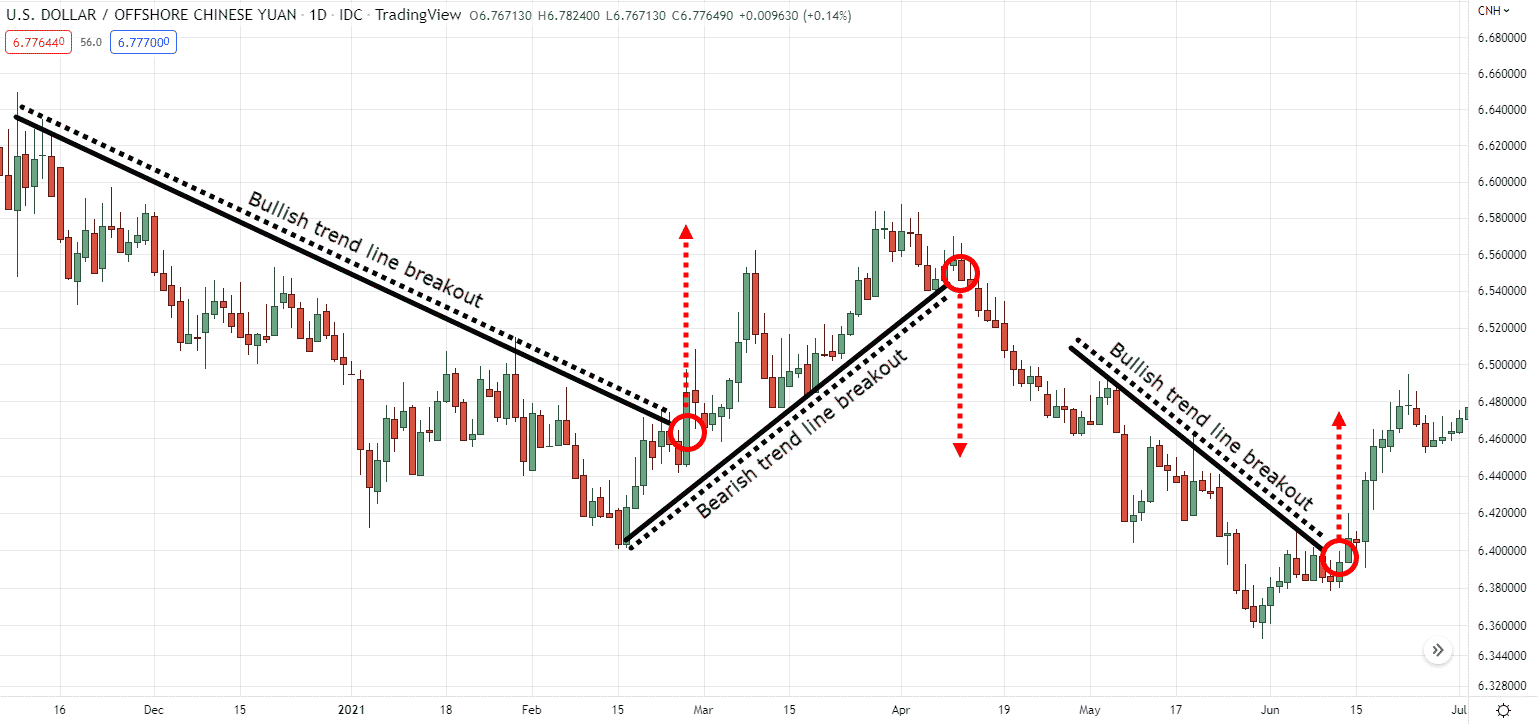
Trend lines can be used to identify trading opportunities in a number of ways. One common method is to look for breakouts from a trend line. A breakout occurs when the price of a currency pair moves above or below a trend line. A breakout can indicate that a new trend is starting, and it can be a good time to enter a trade.
Another way to use trend lines to identify trading opportunities is to look for pullbacks to a trend line. A pullback occurs when the price of a currency pair retreats back to a trend line after a breakout. Pullbacks can be a good time to enter a trade or add to an existing position.

Image: blog.investingnote.com
Determining Stop-Loss and Take-Profit Levels
Trend lines can also be used to determine stop-loss and take-profit levels. A stop-loss is an order that is placed to limit your losses if the price of a currency pair moves against you. A stop-loss order should be placed below a trend line for a long trade and above a trend line for a short trade.
A take-profit order is placed to lock in your profits if the price of a currency pair moves your way. A take-profit order should be placed above a trend line for a long trade and below a trend line for a short trade.
Managing Risk
Trend lines can be used to manage risk by helping you to identify potential trading opportunities and determine stop-loss and take-profit levels. By using trend lines, you can increase your chances of profitability and reduce your risk of loss.
What Is A Trend Line In Forex
Conclusion
Trend lines are a powerful tool that can help Forex traders to identify trading opportunities, determine stop-loss and take-profit levels, and manage risk. By understanding how to draw and use trend lines, you can improve your trading strategy and increase your chances of success.


