

The world of trading and investing is often shrouded in complexity, with countless strategies and tools that traders employ to navigate the ever-fluctuating markets. Among these, Fibonacci retracement levels stand as a prominent technique, capturing the essence of market movements and providing valuable insights into potential price reversals. In this detailed guide, we unravel the intricacies of Fibonacci retracement levels, exploring their calculation, significance, and practical applications.

Image: xaubot.com
The Origins of Fibonacci: A Journey through History
Leonardo Fibonacci, an Italian mathematician who lived during the 12th and 13th centuries, is credited with introducing the Fibonacci sequence to the Western world. This sequence is a series of numbers where each number is the sum of the two preceding ones, beginning with 0 and 1:
0, 1, 1, 2, 3, 5, 8, 13, 21, 34, 55, 89, 144, …
The Fibonacci sequence exhibits remarkable properties, appearing in numerous natural phenomena, such as the spiral patterns of seashells and the arrangement of leaves on plant stems. Surprisingly, this sequence also manifests itself in the financial realm, where it serves as the foundation of Fibonacci retracement levels.
Fibonacci Retracement Levels: A Gateway to Market Insights
Fibonacci retracement levels are horizontal lines drawn on a price chart, representing potential areas of support or resistance. These levels are calculated based on key Fibonacci ratios, derived from the Fibonacci sequence. The most common ratios used in Fibonacci retracement are:
- 0.236 (23.6%)
- 0.382 (38.2%)
- 0.500 (50.0%)
- 0.618 (61.8%)
- 0.786 (78.6%)
Unveiling the Calculation: A Step-by-Step Guide
To determine Fibonacci retracement levels, traders identify two significant price points: a swing high and a swing low. A swing high represents a price peak, while a swing low marks a price trough. Once these points are identified, the following steps are taken:
- Calculate the total vertical distance between the swing high and the swing low.
- Determine the key Fibonacci ratios (0.236, 0.382, 0.500, 0.618, and 0.786) by dividing the height between the swing high and the swing low by these ratios.
- Plot the Fibonacci levels by calculating the vertical distance to each ratio from the swing high and swing low.
For instance, if a stock increases from $10 to $20, the following Fibonacci retracement levels would be calculated:
- 0.236 level: $14.64 ($10 + (20 – 10) x 0.236)
- 0.382 level: $12.80 ($10 + (20 – 10) x 0.382)
- 0.500 level: $11.00 ($10 + (20 – 10) x 0.500)
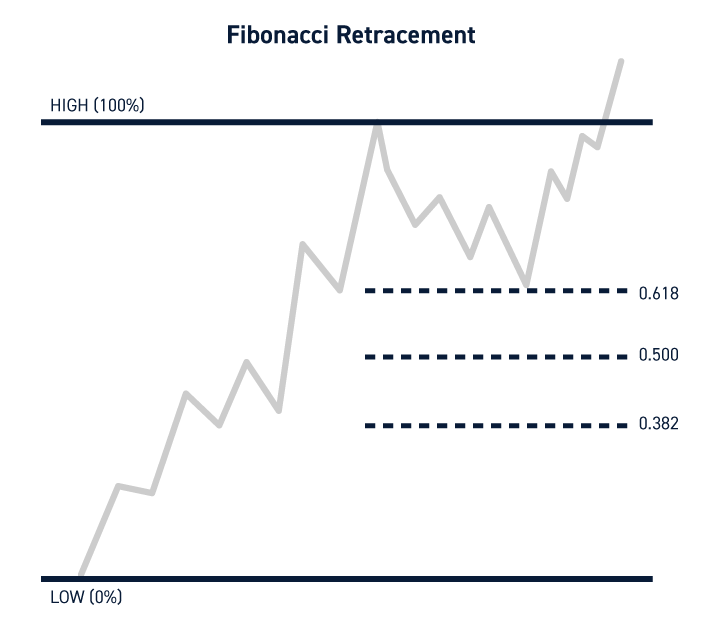
Image: centerpointsecurities.com
Navigating the Markets with Fibonacci Retracements
Fibonacci retracements empower traders to identify potential areas where price reversals are likely to occur. As prices approach these levels, traders can anticipate a temporary pause or even a reversal in the trend. Understanding these levels can provide valuable guidance when making trading decisions, offering a unique perspective on market dynamics.
Moreover, Fibonacci retracements can be employed in conjunction with other technical indicators, such as trend lines, support and resistance levels, and moving averages, to increase the accuracy and reliability of trading signals.
The Practical Applications of Fibonacci in Action
Fibonacci retracement levels find widespread applications in the day-to-day decision-making process of traders and investors. Numerous trading strategies and methodologies incorporate these levels to gauge market sentiment, identify potential entry and exit points, and formulate stop-loss orders.
- Identifying Support and Resistance: Fibonacci retracements help pinpoint potential areas where prices might find support or face resistance. Traders can use these levels to determine strategic trading zones, placing buy orders above support levels and sell orders below resistance levels.
- Price Target Estimation: Fibonacci retracements can provide target price levels, where a previous trend is anticipated to resume. Traders can utilize these levels to set their profit-taking positions, maximizing their returns.
- Risk Management: By incorporating Fibonacci retracement levels into risk management strategies, traders can determine appropriate stop-loss placement and manage risk effectively.
How Are Fibonacci Retracement Levels Calculated
Closing Remarks: The Enduring Power of Fibonacci Retracements
Fibonacci retracements have firmly established their place in the trading arena, offering traders a practical and valuable tool for market analysis. By unraveling the complexities of Fibonacci retracement level calculations and understanding their significance, we gain a deeper comprehension of market dynamics and can navigate the unpredictable waters of trading with greater confidence. Remember, Fibonacci retracement levels are a tool, not a predictive model, and should be used in conjunction with other technical analysis tools to enhance their effectiveness. With continued practice and a keen eye for market movements, the secrets of Fibonacci retracements will unlock a world of trading possibilities.


