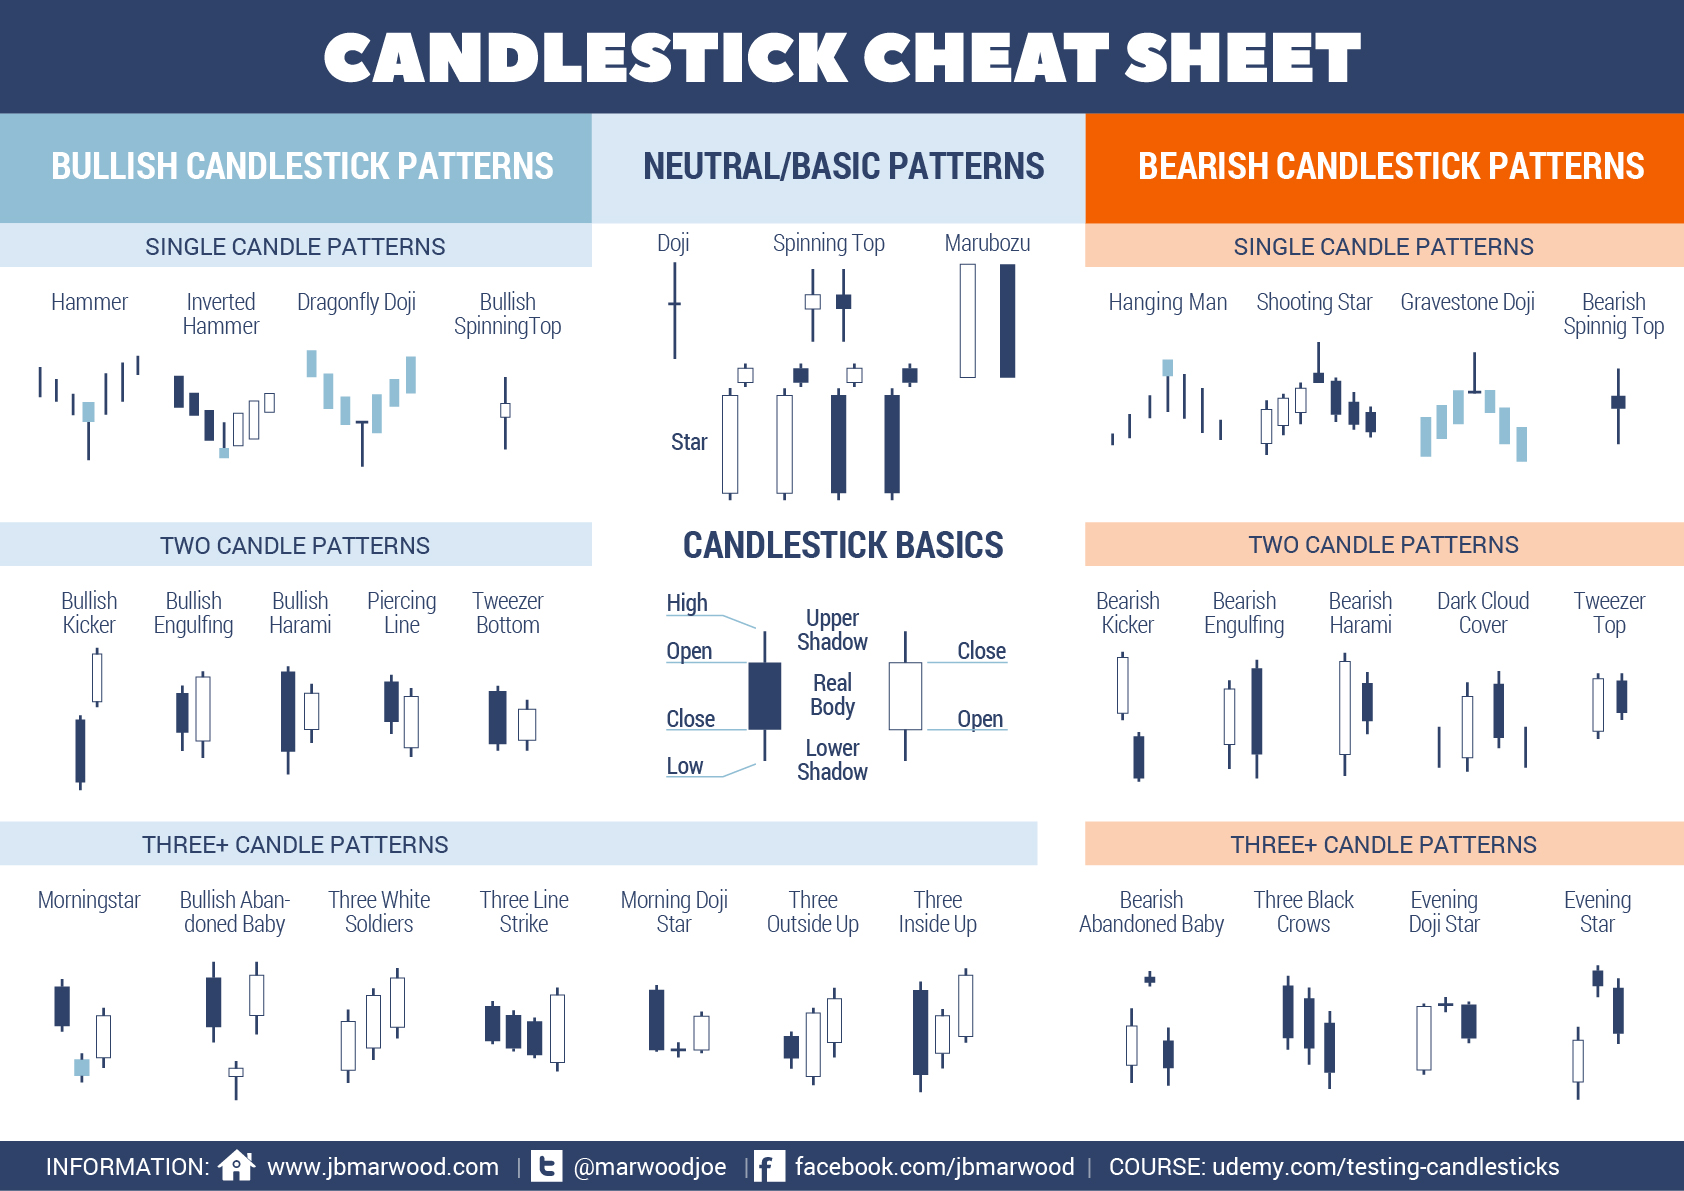
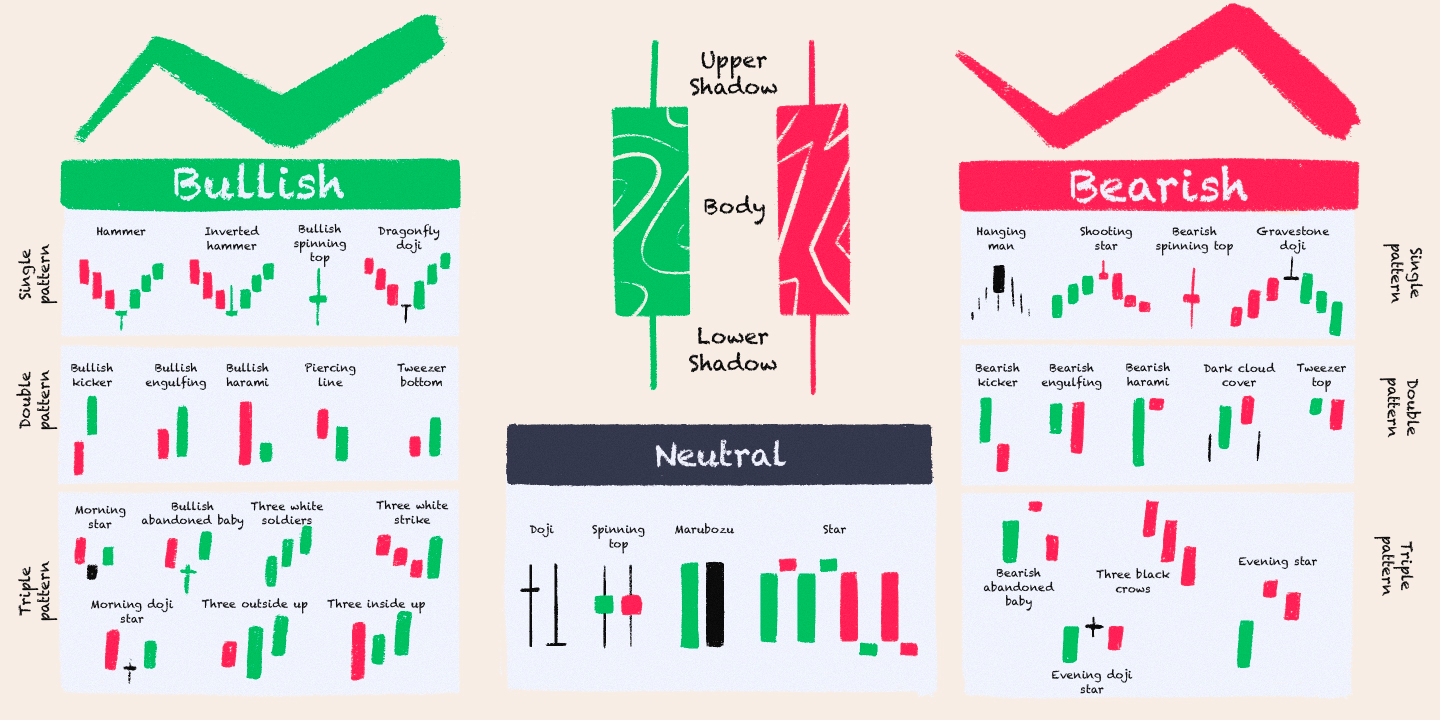
The world of finance can feel daunting, filled with numbers and technical jargon. But for those who dare to delve into the depths of the market, patterns emerge. One of the most captivating, yet often misunderstood, tools for interpreting price movements is the candlestick pattern. These simple yet powerful visual representations can tell a story about the market’s sentiment, revealing potential shifts and opportunities. Imagine you are a seasoned trader, watching the stock market fluctuate – and suddenly, a familiar pattern emerges. A bullish engulfing candlestick, a signal of a possible price surge! It’s this type of insight that makes candlestick patterns so valuable.

Image: www.newtraderu.com
Candlestick patterns are like a secret language spoken by the market. They are a visual representation of price action over a specific period, capturing the interplay of supply and demand. Beyond their aesthetic appeal, they can provide crucial insights into market sentiment and predict potential price movements, making them a valuable tool for both novice and experienced traders.
Understanding the Basics: Decoding the Candlestick
Before diving into the intricacies of various patterns, let’s understand the core components of a candlestick:
The Anatomy of a Candlestick
A candlestick is essentially a visual representation of price action during a specific timeframe. Each candle consists of the following elements:
- Body: This represents the difference between the opening and closing prices. A filled body indicates an upward move (bullish) with the closing price higher than the opening price. A hollow body signifies a downward move (bearish) with the closing price lower than the opening price.
- Upper Shadow (Wick): The upper shadow extends from the body to the highest price point reached during the period. It indicates the extent of buying pressure, signifying resistance.
- Lower Shadow (Wick): The lower shadow extends from the body to the lowest price point reached during the period. It indicates the extent of selling pressure, signifying support.
Candle Patterns: Unveiling the Market’s Secrets
Candlestick patterns are formed by the combination of individual candlesticks, creating unique formations that reveal specific trading signals. These patterns are categorized based on their bullish or bearish implications:

Image: public.com
Bullish Candlestick Patterns
These patterns suggest a potential increase in price and are often viewed as a buying opportunity. Some common Bullish Candlestick patterns include:
- Bullish Engulfing Pattern: This pattern consists of two candles; the first candle is bearish with a small body, followed by a large bullish candle completely engulfing the previous candle. This pattern indicates a shift in market sentiment from bearish to bullish.
- Morning Star: A three-candle pattern, where a bearish candle is followed by a small candle (often called the ‘star’ candle) and finally a bullish candle that closes above the midpoint of the first bearish candle. This pattern suggests a potential reversal from bearish to bullish.
- Piercing Line: Similar to the morning star, this pattern also has three candles. In this case, the first candle is bearish with a long body, then a smaller bullish candle that closes above the midpoint of the first candle.
Bearish Candlestick Patterns
These patterns suggest a potential decrease in price and can be viewed as selling signals. Some common Bearish Candlestick patterns include:
- Bearish Engulfing Pattern: This pattern is the opposite of the bullish engulfing, with a bullish first candle followed by a larger bearish candle engulfing the previous candle. It signals a potential shift from bullish to bearish market sentiment.
- Evening Star: A three-candle pattern, where a bullish candle is followed by a small candle (often called the ‘star’ candle) and finally a bearish candle that closes below the midpoint of the first bullish candle. This pattern suggests a potential reversal from bullish to bearish.
- Shooting Star: Similar to the Evening Star, this pattern has three candles: a bullish candle followed by a candle with a long upper shadow and a small body, and finally a bearish candle.
Tips from the Trenches: Mastering the Art of Candlestick Analysis
Candlestick patterns are like a roadmap through the market’s twists and turns. However, simply recognizing these patterns isn’t enough. Here are some expert tips to effectively incorporate them into your trading strategy:
Context is King: Don’t Forget the Bigger Picture
While candlestick patterns can offer valuable insights, they should always be analyzed within the broader context of the market. Consider factors like:
- Trend: Is the market in an uptrend, downtrend, or sideways? This helps determine if a pattern is confirming the existing trend or signaling a potential reversal.
- Volume: High volume during a candlestick pattern can add weight to the signal, indicating stronger market participation.
- Support and Resistance Levels: Understand where support and resistance levels are located. Are the patterns forming at these key levels, adding significance to their signals?
Patience is a Virtue: Don’t Rush into Trades
Just because a pattern emerges, it doesn’t mean a guaranteed outcome. Patience is essential. Wait for confirmation from other indicators, like moving averages or oscillators, before entering a trade. Avoid impulsivity and respect the market’s timing.
FAQ: A Quick Guide to Candlestick Analysis
Here are some frequently asked questions about candlestick patterns:
Q: Are candlestick patterns reliable?
A: Candlestick patterns are not foolproof, and there is no guarantee of success. However, they can be helpful indicators when used in conjunction with other technical analysis tools and a sound trading strategy.
Q: Can I use candlestick patterns in any market?
A: Candlestick patterns are applicable across various financial markets, including stocks, forex, commodities, and even cryptocurrencies. Their effectiveness may vary depending on the market and timeframe.
Q: How do I identify a candlestick pattern?
A: There are many resources available online and in trading books that provide detailed explanations and illustrations of different candlestick patterns. Practice identifying these patterns on historical charts to gain familiarity.
Different Candlestick Patterns
The Takeaway: Embracing the Language of Candlesticks
Candlestick patterns offer a unique glimpse into the market’s psyche, revealing potential shifts and opportunities. While they are not a guarantee of success, understanding and integrating them into your trading strategy can be a powerful tool. Do you find the concept of candlestick patterns fascinating and useful? We’d love to hear from you!


