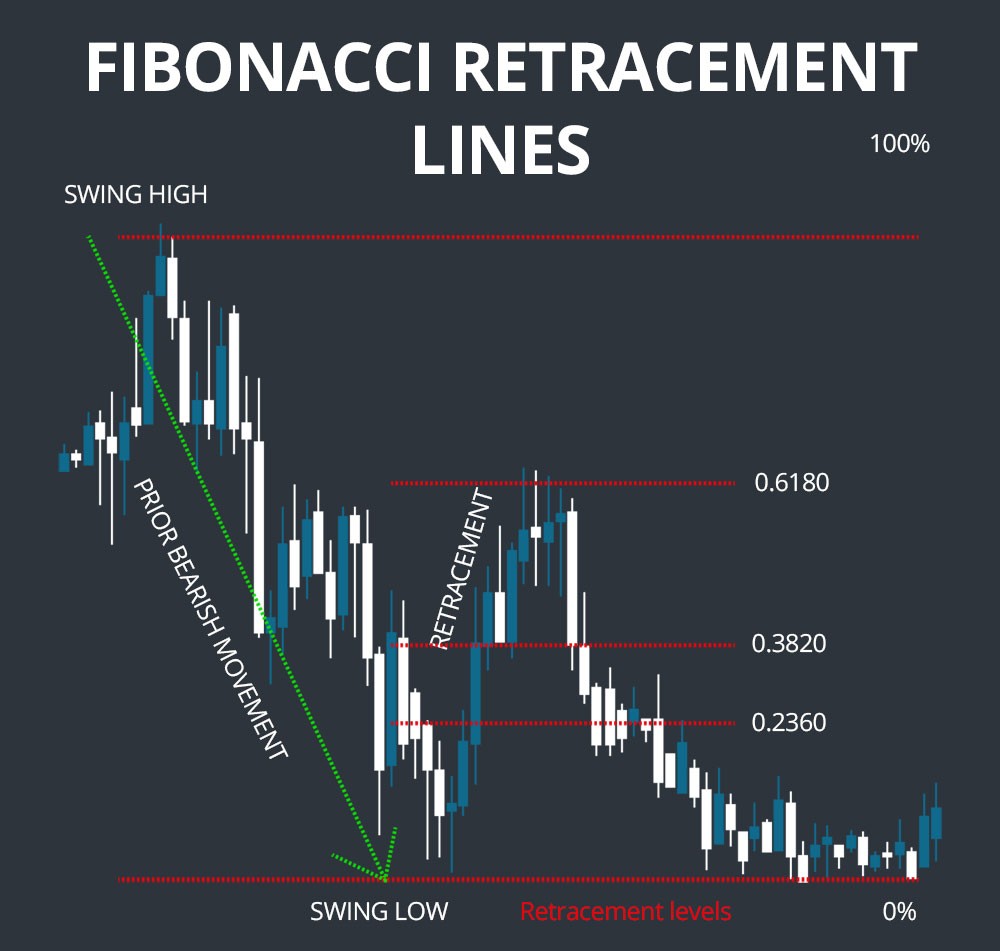
Have you ever felt like the stock market is an unpredictable beast, its movements as erratic as a wild stallion? It’s a feeling shared by many, but what if I told you there’s a tool, a mathematical secret, that can help you navigate these tumultuous waters? This secret weapon, my friend, is the Fibonacci Retracement Tool.

Image: www.forexstrategieswork.com
Imagine you’re sailing through a stormy sea, the waves crashing relentlessly. Knowing the depths of the ocean would give you an advantage, guiding you to safety. The Fibonacci Retracement Tool is your depth gauge, your map to understand the hidden currents of the market. It uses a sequence of numbers, the Fibonacci sequence, to pinpoint potential support and resistance levels in price charts, giving traders a unique insight into market sentiment.
Decoding the Fibonacci Sequence: The Foundation of Market Insight
The Fibonacci sequence, a sequence of numbers where each number is the sum of the two preceding ones (1, 1, 2, 3, 5, 8, 13, 21, 34, …), appears everywhere in nature, from the spiral of a seashell to the arrangement of leaves on a plant. Its surprising presence in the financial world sparked the creation of the Fibonacci Retracement Tool.
The Fibonacci Retracement Tool: A Visual Guide to Market Movements
The tool functions by drawing horizontal lines across a price chart. These lines are placed at specific percentages of a price move, with each line representing a potential support or resistance level. The most common Fibonacci retracement levels are:
-
23.6%: A minor retracement that attracts some buying or selling pressure.
-
38.2%: A more significant retracement that often holds up for a short period.
-
50%: A key retracement level that reflects the middle ground between the high and low of the recent price move.
-
61.8% (The Golden Ratio): This level is often the strongest retracement level.
-
100%: The full extent of the original price move.
Utilizing the Fibonacci Retracement Tool: Mastering Market Psychology
The Fibonacci Retracement Tool works by tapping into the underlying psychology of the market. When prices are moving strongly in one direction, traders often take profits or enter new positions near these retracement levels.
For example, if a stock is rising, traders may choose to buy near the 38.2% retracement level, hoping to catch a bounce back towards the previous highs. Conversely, if a stock is falling, traders may sell near the 61.8% retracement level, looking for a further decline.

Image: investbro.id
Combining Fibonacci Retracement with Other Technical Indicators: A Powerful Synergy
The Fibonacci Retracement Tool works exceptionally well when combined with other technical indicators.
For example, you can use it in conjunction with moving averages to identify potential entry and exit points.
If the price is retracing to the 38.2% Fibonacci level and is also crossing above its 50-day moving average, it could signal a bullish reversal.
Finding Your Trading Edge with Fibonacci Retracement: Cautious Optimism
The Fibonacci Retracement Tool is a valuable tool for traders, but it’s not a crystal ball. It’s essential to understand its limitations and use it in conjunction with other forms of technical analysis. The market is complex, and no single technical indicator can predict the future with certainty.
The tool works best when used in conjunction with other forms of analysis, such as volume analysis, news flow, and candlestick patterns.
The Future of Fibonacci: A Gateway to Investment Success?
The Fibonacci Retracement Tool has been in use for decades and continues to be a popular tool among traders. While it’s not a foolproof method, its ability to reveal market sentiment and pinpoint support and resistance levels makes it a valuable tool in any trader’s arsenal.
Expert Insights from the Masters
Renowned technical analysts often emphasize the importance of using multiple indicators when trading, including Fibonacci retracement. Experienced traders will tell you that these tools, combined with sound money management principles and risk control strategies, can significantly enhance trading success.
Actionable Tips for Integrating Fibonacci Retracement into Your Trading Strategy
-
Start with a clear understanding of Fibonacci retracement levels and their significance.
-
Practice using the tool on historical price charts to develop a feel for how it works in different market conditions.
-
Remember that Fibonacci retracement levels are not always perfect and can be broken.
-
Combine Fibonacci retracement with other technical indicators for a more comprehensive analysis.
-
Always use risk management strategies when trading, such as stop-loss orders.
Fibonacci Retracement Tool
Conclusion: Embracing the Fibonacci Path to Trading Success
You don’t have to be a math whiz to benefit from the Fibonacci Retracement Tool. It’s a powerful tool that can help any trader understand market trends and make more informed trading decisions. Remember, while Fibonacci can guide your path, your trading journey ultimately depends on your own skills, discipline, and understanding of the market. So, be a bold explorer, but be a cautious one.
Let’s continue this journey of uncovering the market’s secrets together. Share your experiences with the Fibonacci Retracement Tool, your insights, and your questions in the comments below. Let’s learn from each other and grow as traders together.


