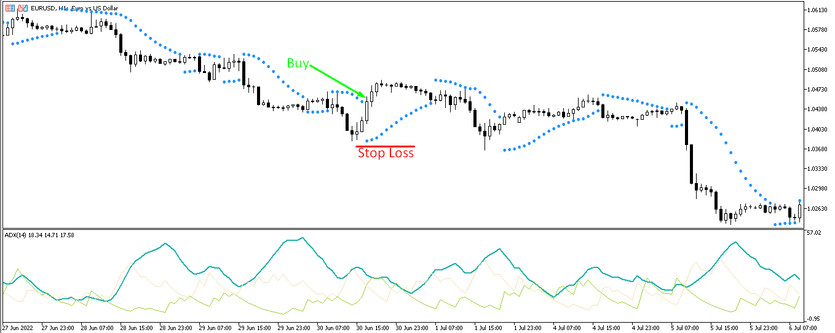
In the competitive realm of forex trading, technical analysis plays a pivotal role in empowering traders to make informed decisions and navigate market complexities. Amidst the plethora of technical indicators available, the Average Directional Index (ADX) and the Parabolic SAR (Stop and Reverse) system stand out as formidable tools for identifying trends and determining market sentiment. This comprehensive guide will delve into the intricacies of these indicators, illustrating their significance and demonstrating their application in real-world trading scenarios.

Image: investworld.net
Understanding the Forex ADX Indicator
Conceived by J. Welles Wilder, the Average Directional Index (ADX) is a non-directional indicator that measures the strength and momentum of a trend. It consists of three lines: the ADX line, the +DI line, and the -DI line. The ADX line ranges from 0 to 100, with values above 25 indicating a strong trend and values below 25 indicating a weak or nonexistent trend. The +DI and -DI lines measure positive and negative price movements, respectively. When the +DI line is above the -DI line, it indicates an upward trend; conversely, when the -DI line is above the +DI line, it indicates a downward trend.
Mastering the Parabolic SAR Indicator
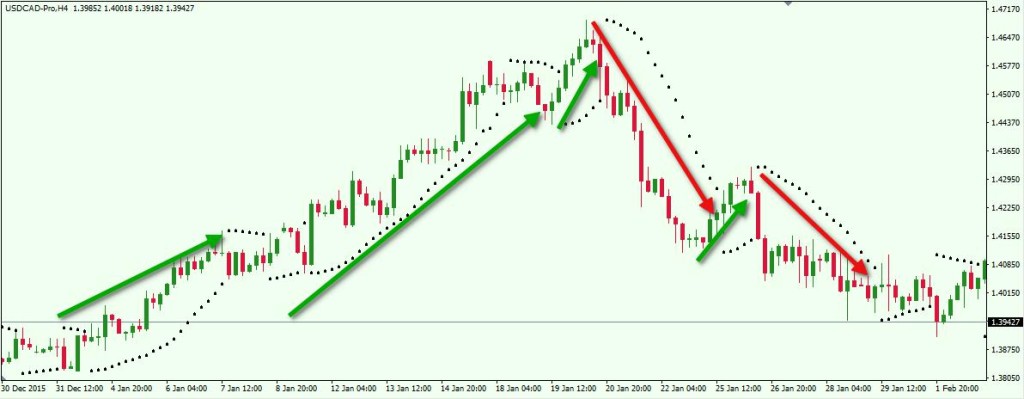
The Parabolic SAR, developed by J. Welles Wilder, is a technical indicator that identifies potential trend reversals. It plots a series of parabolic curves above or below the price chart. When the price is above the SAR, it signifies an uptrend; when the price is below the SAR, it signifies a downtrend. The Parabolic SAR uses two main parameters: the acceleration factor (AF) and the maximum acceleration factor (MAF). The acceleration factor determines the steepness of the parabolic curves, while the maximum acceleration factor limits the maximum value of the acceleration factor.
Combining ADX and Parabolic SAR for Enhanced Trading
The combination of ADX and Parabolic SAR creates a powerful trading system that provides both trend identification and reversal signals. By using the ADX to determine the strength of a trend and the Parabolic SAR to identify potential reversal points, traders can increase the accuracy and profitability of their trades.
When the ADX line is above 25 and the +DI line is above the -DI line, it indicates a strong uptrend. Traders can look for long trading opportunities when the price is above the Parabolic SAR and enter a long trade when the price crosses above the Parabolic SAR. Exit the trade when the ADX line falls below 25 or the Parabolic SAR flips below the price.
Conversely, when the ADX line is above 25 and the -DI line is above the +DI line, it indicates a strong downtrend. Traders can look for short trading opportunities when the price is below the Parabolic SAR and enter a short trade when the price crosses below the Parabolic SAR. Exit the trade when the ADX line falls below 25 or the Parabolic SAR flips above the price.

Image: forextraininggroup.com
Forex Adx And Parabolic Sar System
Conclusion
The Forex ADX and Parabolic SAR system is a powerful technical analysis tool that provides valuable insights into market trends and potential reversals. By combining these indicators, traders can enhance their trading strategies, optimize risk management, and make informed trading decisions that lead to consistent profitability. Embrace the power of these indicators and unlock your full potential in the dynamic world of forex trading.


