The foreign exchange market is a complex and ever-evolving landscape that demands sophisticated tools and techniques for successful navigation. One indispensable indicator that has stood the test of time is the Moving Average Convergence Divergence (MACD), a versatile tool that provides valuable insights into market trends and momentum. In this exhaustive guide, we delve into the intricacies of the MACD indicator, exploring its history, interpretation, and practical applications in the dynamic world of forex trading.

Image: freeforexcoach.com
Understanding the MACD: A Timeless Indicator
Developed by technical analysis pioneer Gerald Appel in the late 1970s, the MACD indicator has become an indispensable tool for traders seeking to identify trends, gauge momentum, and pinpoint potential trading opportunities. Its versatility and effectiveness have been proven over decades of market fluctuations and make it a staple in the toolkit of both novice and seasoned forex traders alike.
At its core, the MACD is an oscillator that measures the relationship between two exponential moving averages (EMAs) of a security’s price. The difference between the faster EMA (typically 12 periods) and the slower EMA (usually 26 periods) is plotted as the MACD line. A nine-period EMA of the MACD line is then calculated, known as the signal line. These three components—the MACD line, the signal line, and the histogram (the area between the MACD line and the signal line)—form the basis of the MACD indicator.
Decoding the MACD
The MACD indicator provides a wealth of information that can assist traders in making informed trading decisions. Here are the key interpretations to keep in mind:
- Bullish Momentum: When the MACD line crosses above the signal line, it signals a potential shift towards an uptrend. A continuation of this trend is indicated by the MACD line remaining above the signal line and moving higher.
- Bearish Momentum: Conversely, when the MACD line falls below the signal line, it indicates a potential shift towards a downtrend. A confirmation of this trend is provided by the MACD line continuing to dip below the signal line and making further downward movements.
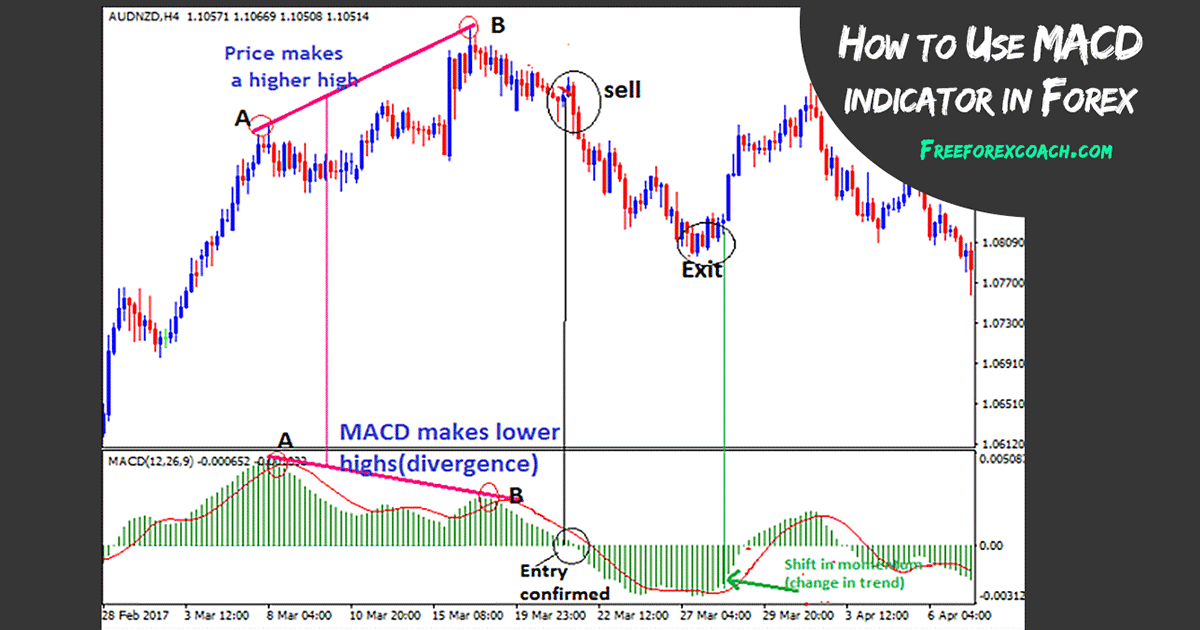
- Overbought and Oversold Conditions: Divergences between the MACD and the underlying price action can indicate overbought (MACD above zero and declining while price makes new highs) or oversold (MACD below zero and rising while price makes new lows) conditions. These divergences can provide timely warnings of potential trend reversals.
- Zero Line Crossovers: The MACD line crossing the zero line upwards or downwards can also signal potential trend changes. A crossover above zero suggests a shift towards bullish momentum, while a crossover below zero indicates a potential transition to bearish territory.
- Histogram: The histogram amplifies the MACD line’s movements, providing a clearer visual representation of the difference between the MACD line and the signal line. Positive values for the histogram indicate bullish momentum, while negative values indicate bearish momentum.
MACD Strategies: Leveraging Insights for Profitable Trading
The MACD indicator offers a plethora of trading strategies that can be tailored to different trading styles and risk appetites. Here are some popular approaches:
- MACD Crossovers: Trading based on MACD crossovers involves entering a long (buy) position when the MACD line crosses above the signal line and exiting the position when the MACD line crosses below the signal line. Conversely, a short (sell) position is initiated when the MACD line crosses below the signal line and exited when the MACD line crosses above the signal line.
- Divergence Trading: Divergence trading seeks to capitalize on divergences between the MACD and the underlying price action. Traders look for instances where the MACD is moving in the opposite direction of the price, signaling potential trend reversals. A buy signal is generated when the MACD turns upwards while the price makes a lower low, and a sell signal is generated when the MACD turns downwards while the price makes a higher high.
- Histogram Trading: Histogram-based strategies focus on identifying turning points in the MACD histogram. A buy signal is generated when the histogram crosses above zero from negative territory, and a sell signal is generated when the histogram crosses below zero from positive territory.
Image: forex-station.com
Best Macd Indicator For Forex
Conclusion
The MACD indicator is a powerful and versatile tool that provides invaluable insights into market trends and momentum, making it a mainstay in the arsenals of forex traders. By understanding the MACD’s components and interpretations, traders can effectively implement various trading strategies to navigate the dynamic forex market and enhance their trading performance. Whether you are a seasoned professional or a novice trader seeking to refine your skills, the MACD indicator can empower you to make informed decisions and seize profitable trading opportunities.


