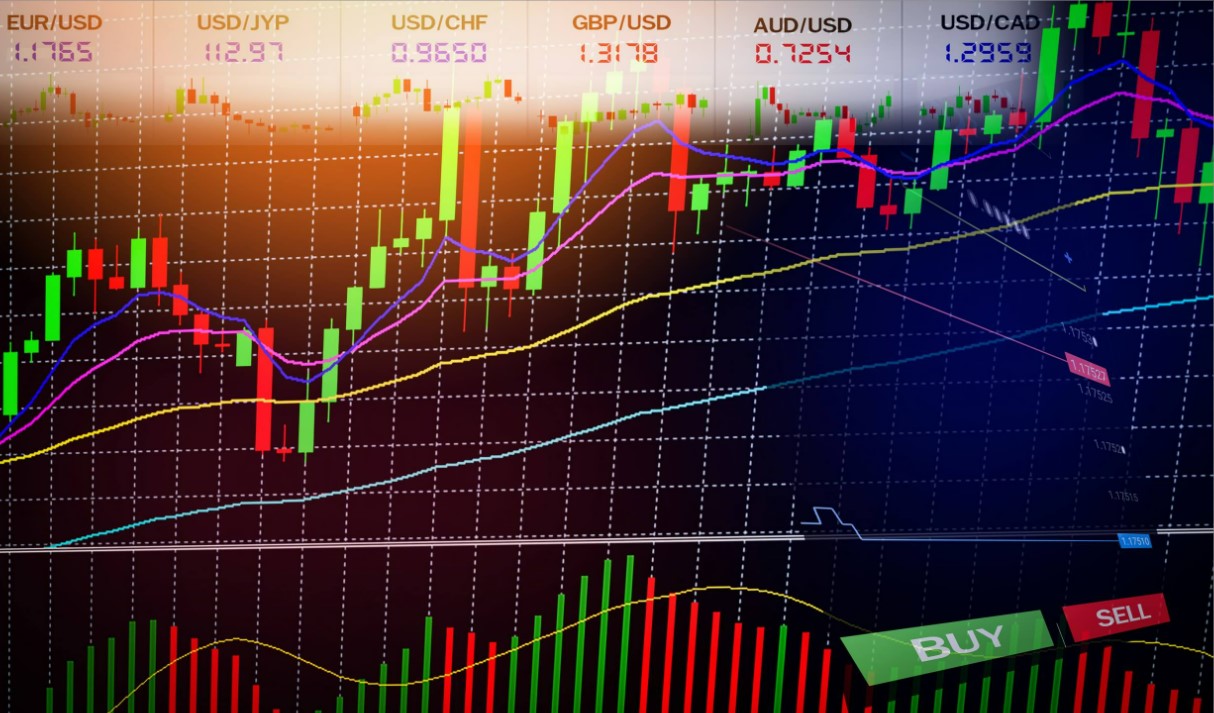
In the dynamic and unpredictable world of forex trading, having the right tools at your disposal is paramount for making informed decisions and maximizing your profit potential. A crucial part of every trader’s arsenal is the use of technical indicators, which provide invaluable insights into market trends, price movements, and potential trading opportunities. However, navigating the vast array of indicators can be daunting, especially for novice traders.

Image: www.forex.academy
This article aims to unravel the complexities and guide you towards the best indicators for forex trading. By combining in-depth explanations with actionable advice from industry experts, we empower you to make informed choices that bolster your trading strategy and propel you towards financial success.
Uncovering the Best Indicators for Your Forex Trading Journey
At the heart of successful forex trading lies the ability to anticipate market movements and identify potential trading opportunities. Technical indicators, when applied judiciously, become your indispensable allies in this endeavor. These mathematical formulas analyze historical price data to generate valuable information about current market trends, potential turning points, and areas of support and resistance.
The multitude of technical indicators available can be overwhelming, but each indicator serves a distinct purpose and caters to specific trading styles and market conditions. To identify the best indicators for your trading strategy, it’s essential to understand the nuances and functionalities of each indicator.
An In-depth Analysis: Delving into the Functionality of Indicators
1. Moving Averages: A Timeless Classic
Moving averages (MAs) provide a smoothed representation of price action over a specified period. By calculating the average price over a specific number of periods, MAs help traders identify the overall trend and filter out market noise. Traders can use simple moving averages (SMAs) or exponential moving averages (EMAs), depending on the desired level of responsiveness.
2. Bollinger Bands: Defining Market Volatility
Bollinger Bands are an envelope-style indicator that encompasses the price action within two standard deviations above and below a moving average. Traders use Bollinger Bands to gauge market volatility and identify potential breakout or consolidation zones. When prices exceed the upper or lower Bollinger Bands, it often signals a potential change in trend.
3. Relative Strength Index (RSI): Measuring Market Momentum
The Relative Strength Index (RSI) measures the magnitude of recent price changes to indicate whether the market is overbought or oversold. An RSI value above 70 suggests an overbought market, while an RSI value below 30 indicates an oversold market. Traders can use RSI divergences to identify potential trend reversals.
4. Ichimoku Cloud: A Comprehensive System
The Ichimoku Cloud is a complex indicator that combines multiple elements, including moving averages, oscillators, and a cloud that represents potential support and resistance levels. The Ichimoku Cloud provides a comprehensive view of market trends and is favored by traders who prefer a systematic approach.
5. Fibonacci Levels: Embracing Nature’s Golden Ratio
Fibonacci levels are based on the Fibonacci sequence, a series of numbers where each number is the sum of the two preceding ones. Fibonacci levels are used to identify potential areas of support and resistance, as well as potential price retracements.
Harnessing Expert Insights: Unlocking the Power of Indicators
Incorporating technical indicators into your trading strategy is an art that requires both knowledge and practice. To enhance your understanding and maximize the potential of these indicators, it’s wise to seek guidance from seasoned forex traders and industry experts. Here are some valuable insights from the professionals:
-
Trading with Moving Averages: “Moving averages are particularly effective in identifying long-term trends and providing support and resistance levels. However, traders should use multiple moving averages with different periods to avoid false signals.” – John Bollinger, renowned technical analyst
-
Understanding Bollinger Bands: “Bollinger Bands offer excellent insights into market volatility. When prices break out or bounce off the Bollinger Bands, it’s a strong indication of potential market shifts.” – Bollinger
-
Trading with the RSI: “The RSI is best used as a confirmation tool to identify overbought and oversold conditions. Combine the RSI with other indicators for more reliable signals.” – J. Welles Wilder, creator of the RSI
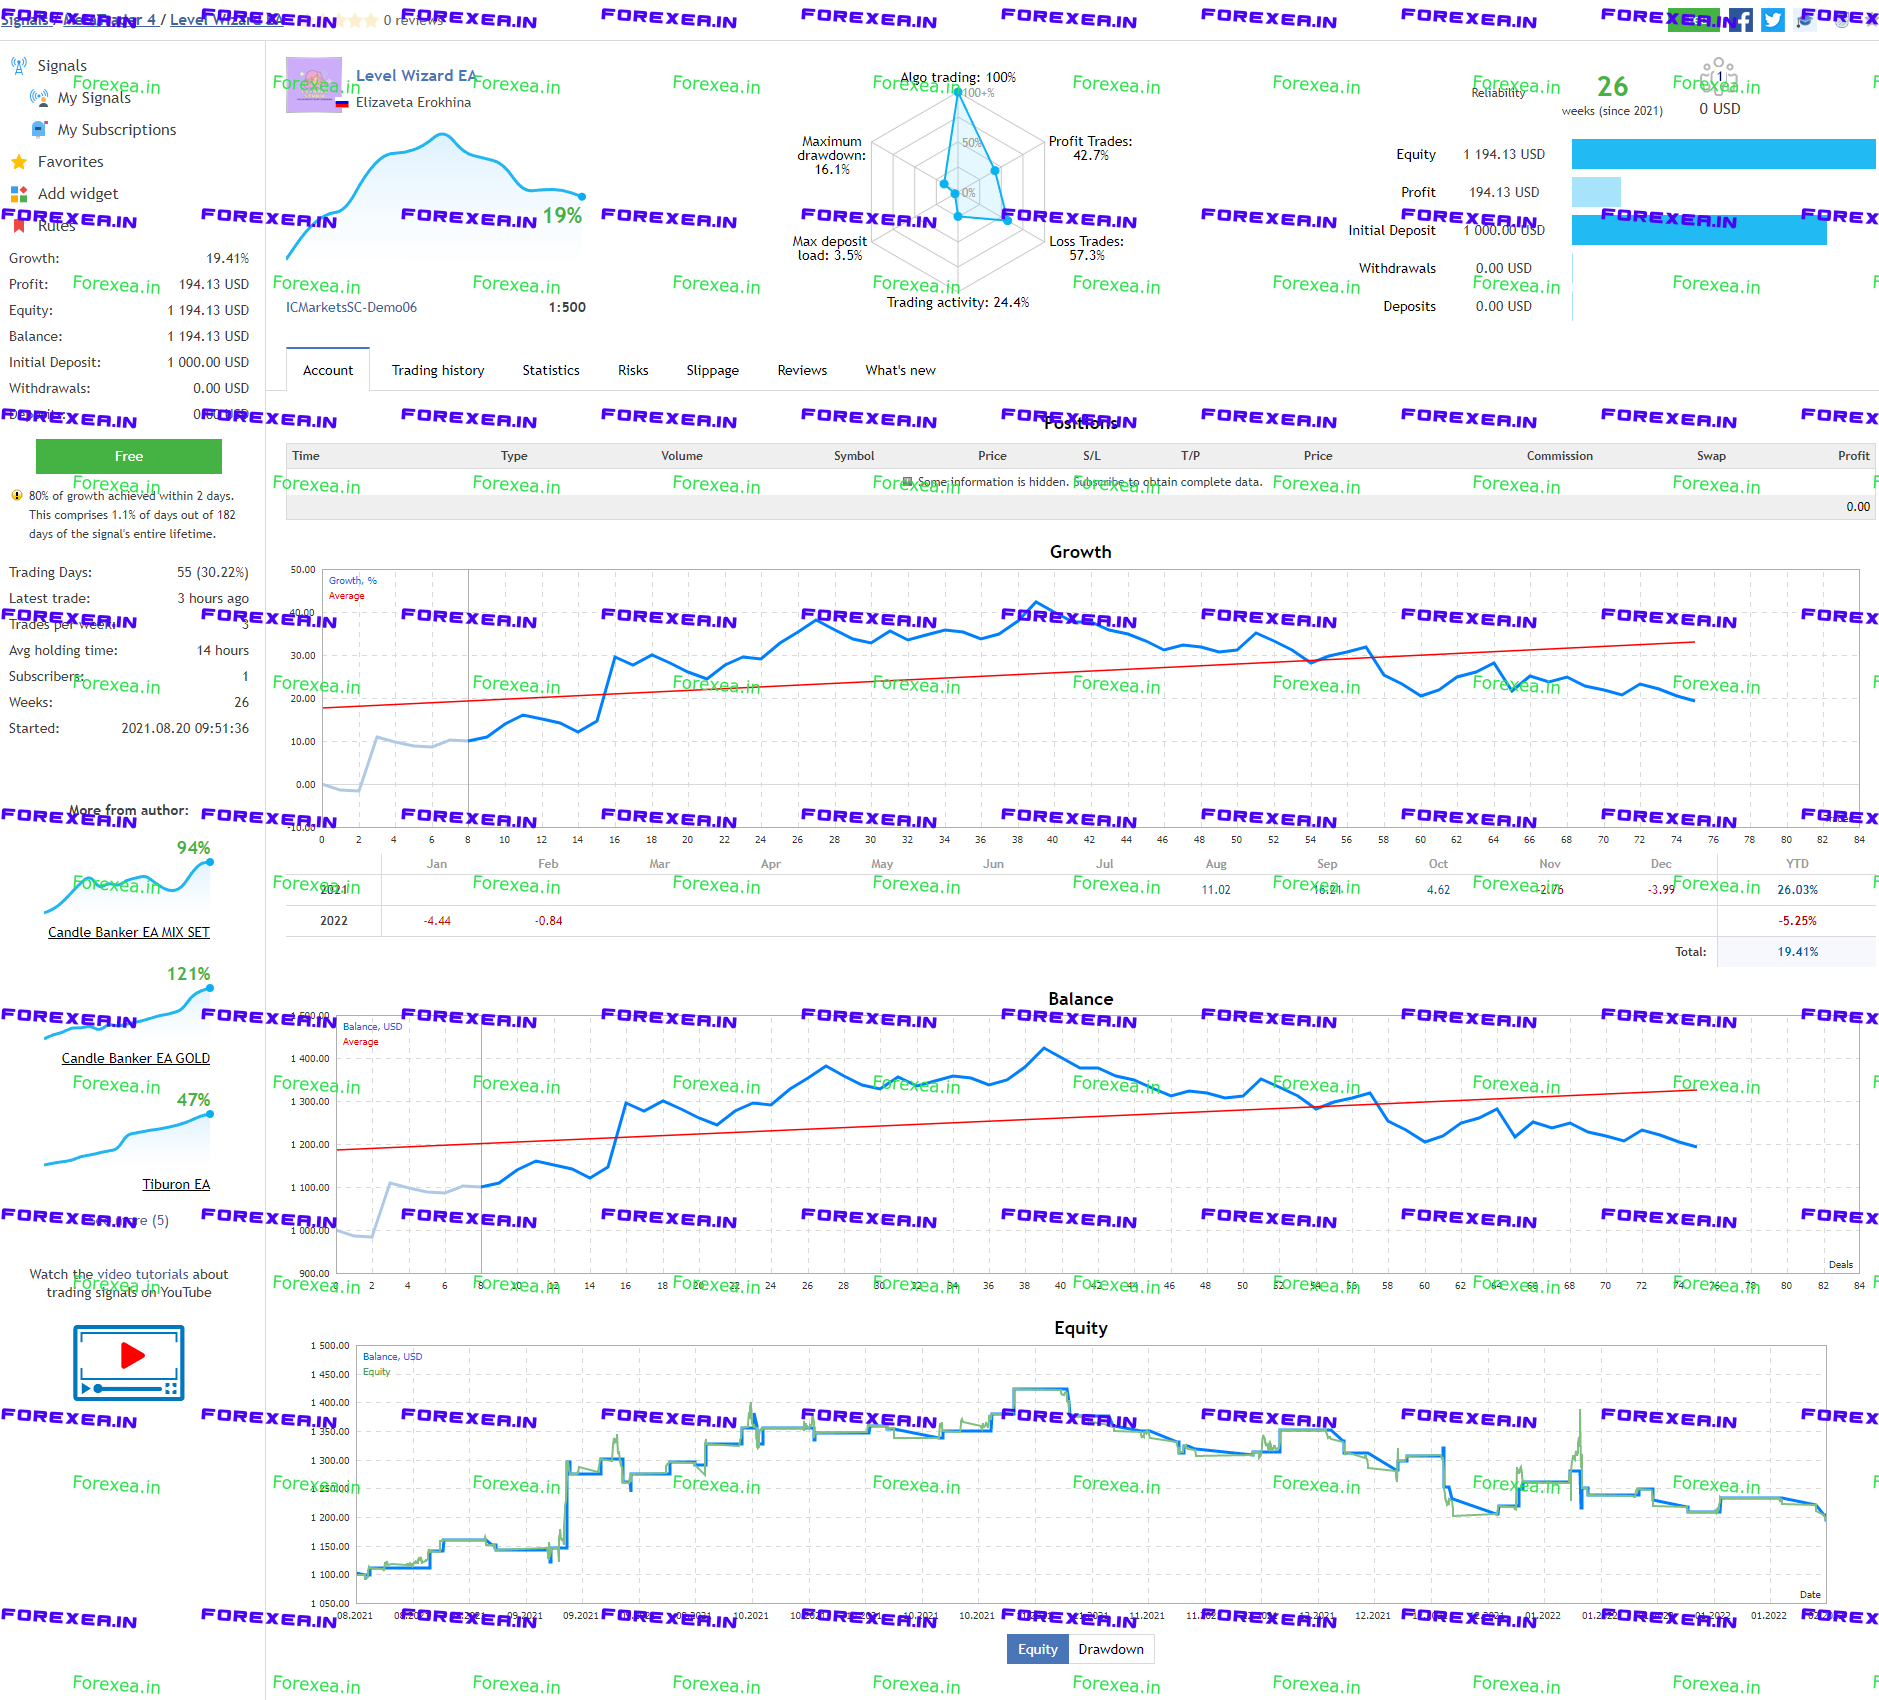
Image: needforexbonus.blogspot.com
The Best Indicators For Forex Trading
Conclusion: Empowering Your Trading Journey
In the vast realm of forex trading, the best indicators become your compass, guiding you towards informed decisions and enhancing your profit potential. By understanding the nuances of each indicator, leveraging expert insights, and customizing your strategy to suit your trading style, you unlock a world of opportunities. Embrace the knowledge and empower yourself with the best indicators for forex trading to navigate the markets with confidence and achieve your financial aspirations.


