In the ever-evolving realm of Forex trading, technical indicators have become indispensable tools for navigating the complexities of currency markets. Among these indicators, the Moving Average Convergence Divergence (MACD) stands tall as a formidable ally for traders seeking to decipher market trends and optimize their trading strategies.

Image: mappingmemories.ca
Deciphering the MACD: Unlocking Its Potential
The MACD is a momentum indicator that measures the relationship between two exponential moving averages (EMAs) of an asset’s price. By comparing the 12-day EMA to the 26-day EMA, traders can derive valuable insights into market momentum, trend reversals, and trading opportunities.
Harnessing the Power of MACD: A Step-by-Step Guide
- Calculate the MACD: Subtract the 26-day EMA from the 12-day EMA to determine the MACD value.
- Plot the MACD Histogram: Use the MACD value to generate a histogram below the price chart. Positive values indicate that the 12-day EMA is above the 26-day EMA, signaling a potential uptrend.
- Incorporate the Signal Line: Compute the 9-day EMA of the MACD to create the signal line. This line offers a smoothed representation of the MACD, helping traders identify potential trading opportunities.
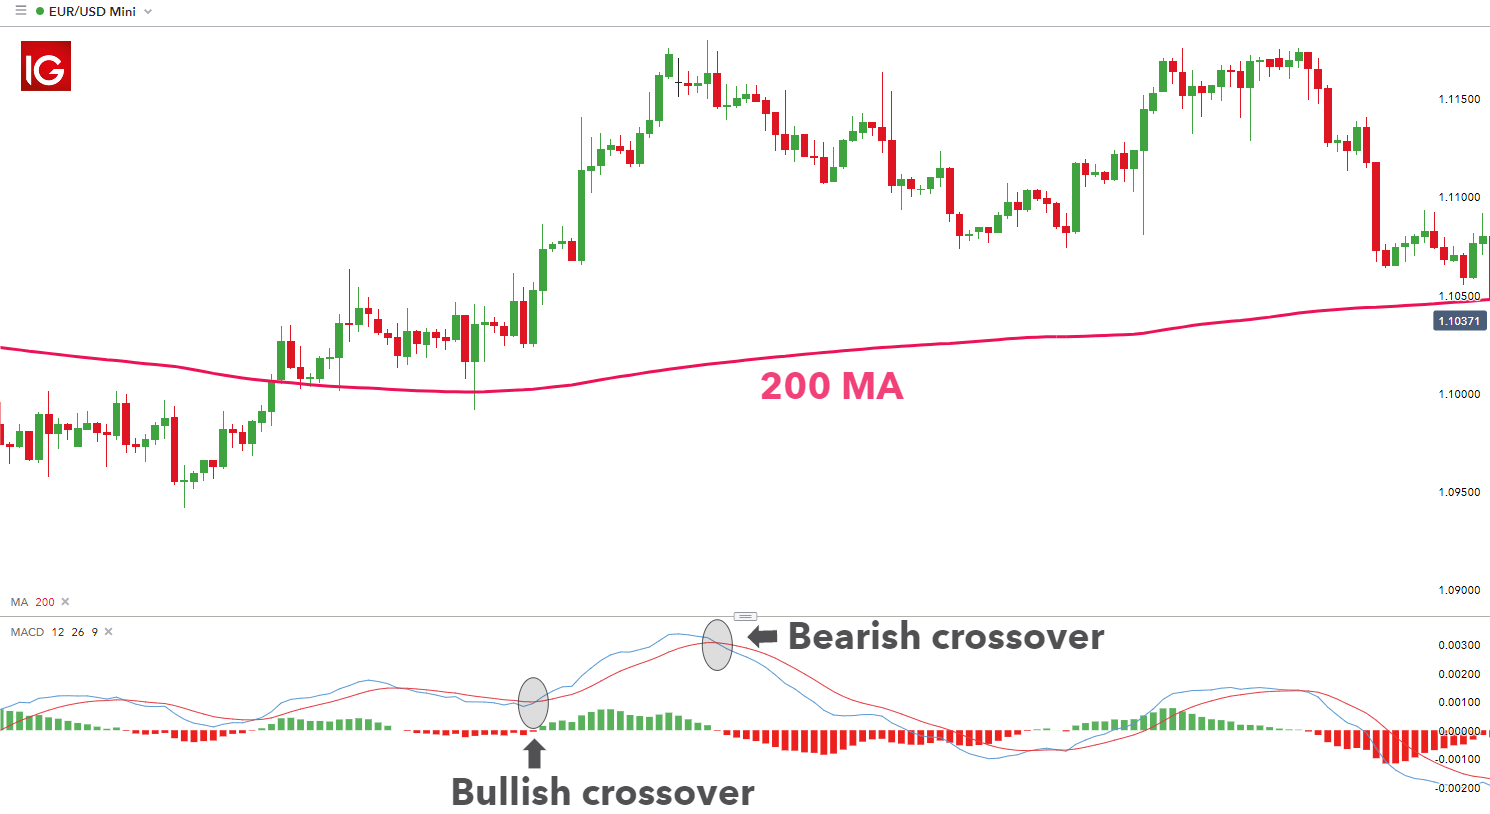
- Analyze Crossovers: When the MACD crosses above the signal line, it suggests a bullish trend. Conversely, when the MACD falls below the signal line, it may indicate a bearish trend.
MACD in Practice: Trend Identification and Trade Timing
By utilizing the MACD, traders can effectively gauge market momentum and make informed trading decisions. A rising MACD histogram, accompanied by a MACD crossover above the signal line, suggests that the underlying asset is gaining momentum and could be poised for an uptrend.
Contrarily, a falling MACD histogram and a MACD crossover below the signal line may indicate a downtrend. Traders can leverage this information to capitalize on potential reversal opportunities, either by selling at resistance levels or buying at support levels.

Image: www.dailyfx.com
Expert Insights: Enhancing Your MACD Trading
- Combine MACD with Other Indicators: Pair MACD with additional technical indicators, such as Bollinger Bands or Relative Strength Index (RSI), for a more comprehensive market analysis.
- Set Realistic Profit Targets: When identifying trade setups using MACD, it’s crucial to establish realistic profit targets and adhere to risk management strategies.
FAQs: Unraveling Common MACD Queries
Q: What is the significance of the MACD’s histogram?
A: The MACD histogram provides a visual representation of the difference between the MACD and the signal line, highlighting potential trends and reversal opportunities.
Q: How do I interpret a MACD crossover above or below the zero line?
A: A MACD crossover above the zero line indicates a shift from a downtrend to an uptrend. Conversely, a crossover below the zero line suggests a transition from an uptrend to a downtrend.
How To Use Macd Indicator In Forex Trading
Conclusion: Embracing the MACD Advantage
The MACD is an indispensable technical indicator that empowers Forex traders with a comprehensive understanding of market dynamics. By harnessing its power, traders can refine their trading strategies, optimize entry and exit points, and increase their chances of success in the ever-fluctuating currency markets.
Are you ready to delve deeper into the intricacies of MACD trading? Explore the vast array of educational resources available online to further enhance your knowledge and gain a competitive edge in the Forex arena.


