In the fast-paced world of forex trading, the ability to decipher and interpret charts is paramount to success. Understanding the intricacies of technical analysis empowers traders with the knowledge and skills necessary to make informed decisions, identify trading opportunities, and navigate market volatility with increased confidence.

Image: www.forex.com
Chart analysis, the backbone of technical trading, involves studying the price movements of a currency pair over time. By examining historical data and identifying patterns, traders can anticipate future price trends, assess market sentiment, and fine-tune their trading strategies. Embark on a journey through this comprehensive guide, unlocking the secrets of forex chart analysis and unlocking new levels of trading prowess.
Candlestick Charts: Illuminating Price Action
Candlestick charts, the cornerstone of technical analysis, provide a graphical representation of price movements over a specific time frame. Each candlestick comprises four components, the open, high, low, and close prices, depicting the market’s oscillations throughout the trading period. Red or black candles indicate downward or upward price movement, respectively, while wicks below or above the body denote the trading range.
Japanese rice traders in the 18th century developed candlestick charting, and its enduring popularity stems from its ability to convey a wealth of information concisely. Understanding candlestick patterns can provide crucial insights into market dynamics, from bullish and bearish engulfing patterns to doji candles signaling indecision.
Trend Lines: Capturing Market Momentum
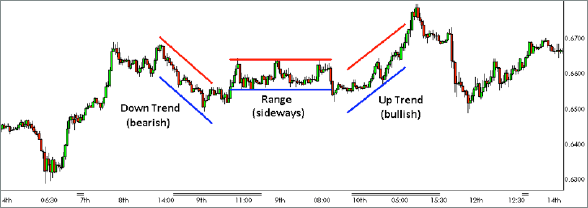
Trend lines, simple yet effective, connect a series of swing highs or lows to identify the overall market direction. An upward sloping trend line suggests a bullish trend, with higher highs and higher lows. Conversely, a downward sloping trend line indicates a bearish trend, characterized by lower highs and lower lows.
Drawing accurately and monitoring the breakout points of trend lines can help traders capitalize on prevailing market trends. Breaking above a resistance trend line signals potential buying opportunities, while breaking below a support trend line may indicate a bearish reversal.
Moving Averages: Smoothing Market Noise
Moving averages (MAs) smooth out price fluctuations, providing a clearer picture of the underlying trend. They are calculated by averaging the closing prices of a security over a specified period, with different timeframes yielding distinct perspectives.
Traders commonly use three types of MAs: simple moving averages (SMAs), exponential moving averages (EMAs), and weighted moving averages (WMAs). SMAs give equal weight to each data point, while EMAs place greater emphasis on recent prices, making them more responsive to market changes. WMAs assign higher weights to recent prices, resulting in even smoother lines.

Image: howtotradeonforex.github.io
Support and Resistance Levels: Identifying Pivotal Points
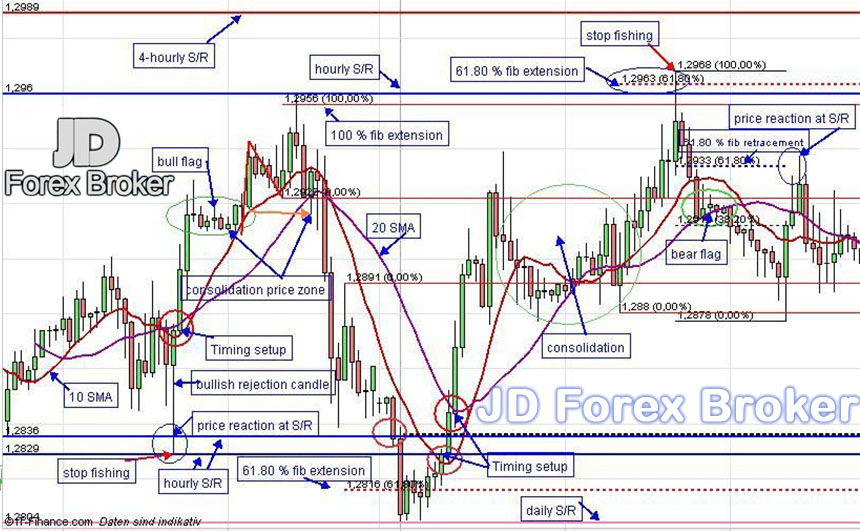
Support and resistance levels are critical price levels at which momentum shifts. Support levels indicate areas where buyers tend to step in and buy, preventing prices from falling further. Resistance levels, on the other hand, represent areas where sellers dominate, pushing prices down.
Identifying and trading around support and resistance levels is a fundamental aspect of forex chart analysis. When prices approach a support level, a bounce is often anticipated. Conversely, when prices reach a resistance level, a pullback is commonly expected.
Technical Indicators: Quantifying Market Sentiment
Technical indicators are mathematical calculations applied to price data to identify trends, patterns, and trading signals. They provide an objective perspective on the market, supplementing subjective analysis.
Numerous technical indicators exist, each with its own strengths and weaknesses. Some popular indicators include the relative strength index (RSI), stochastic oscillator, moving average convergence divergence (MACD), and Bollinger Bands.
RSI measures the relative strength of bulls and bears, indicating potential overbought or oversold conditions. The stochastic oscillator gauges market momentum and identifies potential turning points. MACD quantifies the difference between two moving averages, revealing potential trend reversals. Bollinger Bands provide a measure of market volatility, identifying areas of potential support and resistance.
Risk Management: A Prudent Approach
While technical analysis can enhance trading strategies, it is crucial to remember that it is not a crystal ball. Market conditions can change rapidly, and no trading tool can guarantee success.
Risk management, therefore, is paramount for every forex trader. Define strict risk parameters, including position size and stop-loss levels, to manage potential losses. Diversify your portfolio across multiple currencies and asset classes to reduce the impact of any single market swing.
How To Analyse Charts In Forex Trading
Continuous Learning: The Path to Mastery
Mastering chart analysis is a continuous pursuit, requiring dedication and a commitment to learning. Stay abreast of the latest market trends, economic news, and technical analysis techniques. Participate in online forums, attend webinars, and enrich your knowledge base.
Embrace the challenges of the financial markets, continually refining your trading strategies, and unlocking the true power of chart analysis. With resilience, perseverance, and a thirst for knowledge, you can elevate your trading skills to new heights.


