Navigating the turbulent waters of forex trading demands a keen eye for market fluctuations. Volatility charts emerge as an indispensable tool in this endeavor, offering a visual representation of currency pair price movements and their intensity. Embark on a journey to demystify volatility charts and harness their power to elevate your trading strategies.

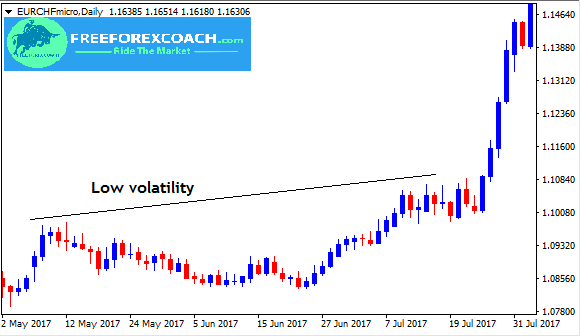
Image: freeforexcoach.com
Volatility: The Key to Forex Trading Success
Understanding volatility is crucial for prudent forex trading decisions. In essence, volatility gauges the degree of price fluctuations within a specific currency pair over a given period. High volatility indicates rapid and substantial price swings, while low volatility suggests relatively stable prices. Mastering the art of deciphering volatility charts empowers traders to identify potential profit opportunities and manage risk effectively.
Unlocking Volatility Charts
Volatility charts are a visual representation of the historical price range of a currency pair, marked by upper and lower bands. The width of these bands corresponds to the volatility, indicating the extent of potential price fluctuations. A wider band signifies greater volatility, while a narrower band suggests lower volatility. By plotting these bands over time, traders can discern volatility patterns and gain insights into market behavior.
Volatility charts are typically displayed as candlesticks or lines, with each candlestick representing a specific time frame (e.g., daily, hourly, or 15-minute). The candlestick’s body indicates the price range between the opening and closing prices, while the wicks (lines extending from the top and bottom of the body) depict the highest and lowest prices reached during that period. By analyzing these candlestick patterns and the relative width of the volatility bands, traders can identify trends, support and resistance levels, and potential breakout points.
Trending Tactics: Unveiling Market Momentum
Volatility charts serve as a valuable tool for identifying market trends. When volatility bands trend upwards, it suggests increasing price volatility and potential for substantial market moves. Conversely, trending downwards volatility bands indicate decreasing volatility and a more stable market environment. Understanding these trends empowers traders to align their strategies with market conditions – adopting more aggressive approaches during periods of high volatility and exercising caution when volatility subsides.

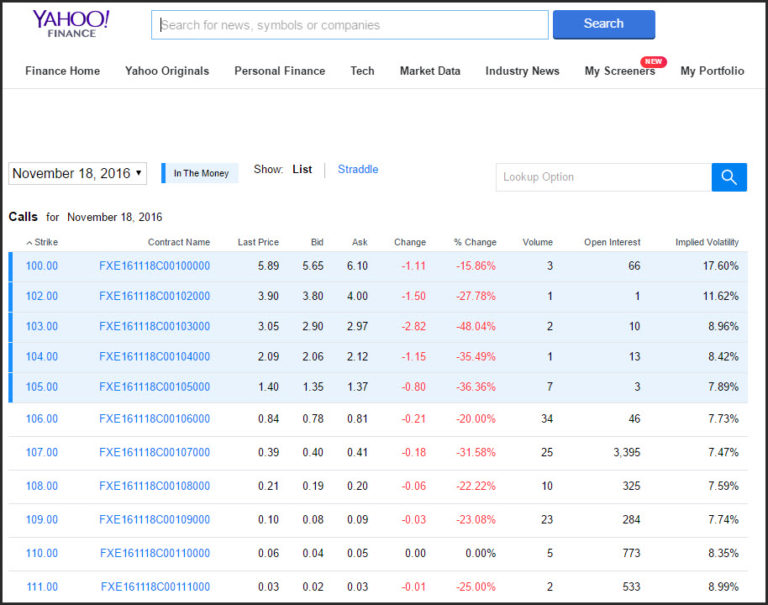
Image: forextraininggroup.com
Bollinger Bands: A Technical Trading Staple
Among the most widely utilized volatility indicators are Bollinger Bands, devised by renowned trader John Bollinger. Bollinger Bands comprise three lines: an upper band, a lower band, and a middle band. The middle band represents a moving average, typically the Simple Moving Average (SMA) of the closing prices over a specified period. The upper and lower bands are then calculated by adding or subtracting a standard deviation multiple (usually two or three) to the middle band.
Bollinger Bands provide insights into volatility, price momentum, and potential trading opportunities. When the currency pair’s price moves outside the Bollinger Bands, it signifies a period of high volatility and increased potential for sharp price movements. Prices that consistently breach the upper Bollinger Band indicate an upward trend, while persistent breaches below the lower Bollinger Band suggest a downtrend. Traders can exploit price movements within these bands to identify potential entry and exit points, taking advantage of market momentum.
Trading Strategies: Navigating Volatile Waters
Armed with the knowledge of volatility charts and volatility indicators, traders can devise effective trading strategies tailored to their risk tolerance and trading style. Below are some time-tested strategies that leverage volatility charts to enhance trading outcomes:
- Breakout Trading: When a currency pair’s price breaks through a period of low volatility (indicated by narrow Bollinger Bands), it signals a potential breakout and the commencement of a new trend.
- Range Trading: During periods of low volatility, currency pairs tend to trade within a constrained range. Identifying these ranges through volatility charts enables traders to capitalize on price movements within the range boundaries.
- Trend Following: Volatility charts can identify the prevailing market trend. By aligning trading positions with the trend, traders aim to ride the momentum and potentially maximize profits.
Volatility Management: Mitigating FX Market Risks
In the dynamic realm of forex trading, managing volatility is paramount for protecting capital and safeguarding profits. Prudent risk management practices incorporate measures such as:
- Position Sizing: Carefully determining the size of trading positions relative to account equity helps mitigate potential losses in the event of adverse market movements.
- Stop-Loss Orders: These orders automatically execute trades when the price falls below a predetermined level, limiting potential losses.
- Hedging Strategies: Employing currency pairs with opposing correlations to offset potential losses.
FAQs: Deciphering Volatility Charts
**Q: What types of volatility charts are available?**
A: Volatility charts can be displayed as candlesticks, lines, or Bollinger Bands. Each type provides unique insights into volatility and price patterns.
**Q: How do I determine the volatility of a currency pair?**
A: Observe the width of the volatility bands or the Bollinger Bands. Wider bands indicate higher volatility, while narrower bands suggest lower volatility.
**Q: Can volatility charts predict future price movements?**
A: Volatility charts do not provide exact predictions but offer insights into market trends and potential price fluctuations. By identifying areas of high and low volatility, traders can make informed decisions.
Volatility Chart For Currency Pairs In Forex Trading
Conclusion
Volatility charts emerge as an indispensable tool for forex traders, offering a comprehensive understanding of currency pair price movements and their intensity. By mastering the art of deciphering volatility charts and incorporating them into their trading strategies, traders gain a competitive edge by identifying trends, predicting breakouts, and managing risk effectively. The insights derived from these charts empower traders to navigate the turbulent waters of forex trading with confidence and poise. Embrace volatility charts today and amplify your trading prowess!


