Introduction:
In the ever-evolving realm of financial trading, understanding market trends and predicting price movements is paramount. Among the plethora of technical analysis tools, the Fibonacci levels stand out as a revered and potent indicator. Derived from the renowned Fibonacci sequence, these levels play a pivotal role in deciphering market sentiment and identifying potential trading opportunities. Embark on this comprehensive guide as we delve into the intricacies of Fibonacci levels, empowering you with the knowledge to navigate the financial markets with greater confidence and precision.

Image: howtotrade.com
Understanding the Fibonacci Sequence:
Before unraveling the Fibonacci levels, let’s establish a firm foundation by exploring the fascinating Fibonacci sequence. This mathematical sequence, discovered by the brilliant Italian mathematician Leonardo Fibonacci in the 13th century, is defined by the following rule: each number is the sum of the two preceding numbers. The sequence begins as:
0, 1, 1, 2, 3, 5, 8, 13, 21, 34, 55, 89, …
The Fibonacci sequence exhibits remarkable patterns that have captivated mathematicians, scientists, and traders alike. One such pattern is the Golden Ratio, approximately 1.618, which is found throughout nature and art. This unique ratio holds particular significance in financial technical analysis, forming the cornerstone of Fibonacci levels.
Fibonacci Retracements: Pinpointing Support and Resistance
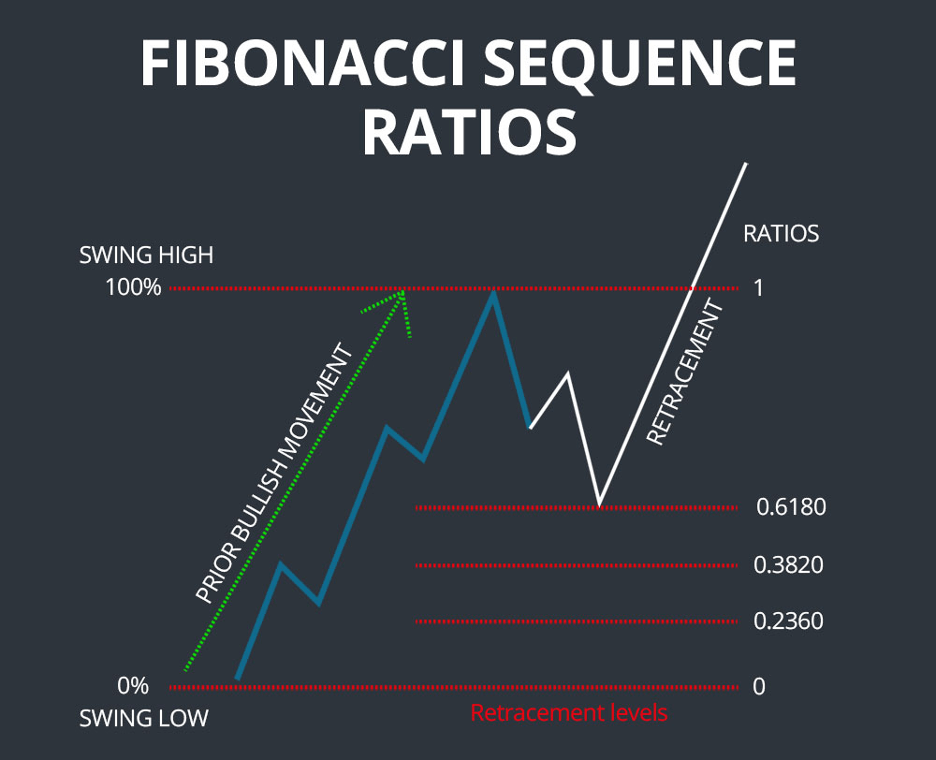
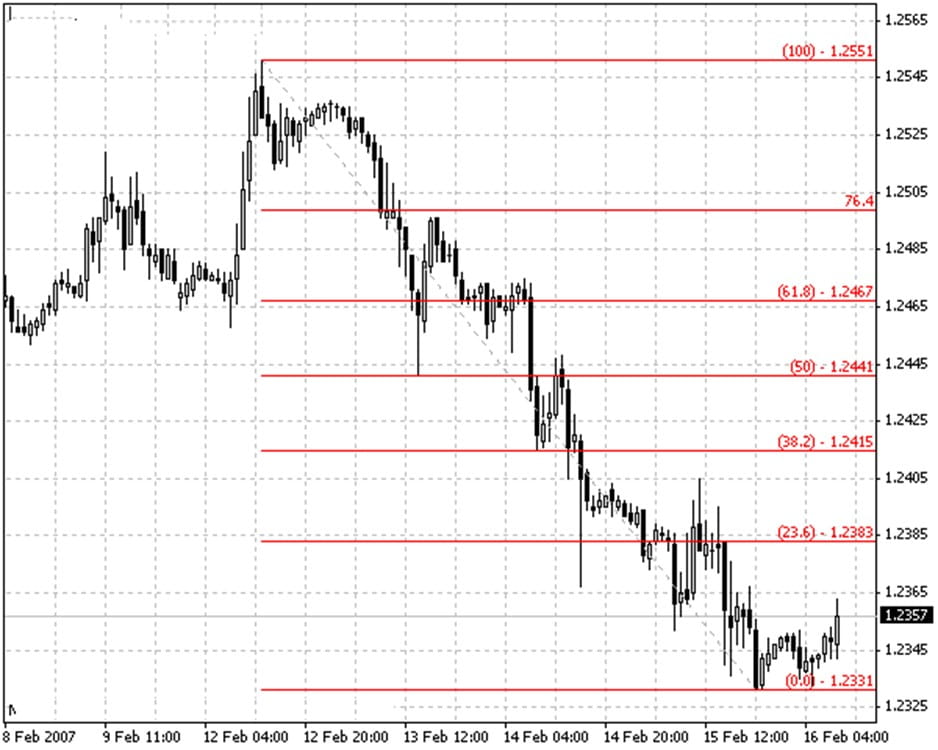
Fibonacci retracements represent one of the most widely utilized applications of Fibonacci levels in trading. These retracements are based on the premise that, following a significant price trend, the market often undergoes a temporary pullback or retracement that aligns with a specific Fibonacci level. The most common Fibonacci retracement levels are:
23.6%
38.2%
50%
61.8%
78.6%
By identifying these retracement levels, traders can anticipate potential areas of support or resistance and make informed decisions about entering or exiting trades.
Fibonacci Extensions: Projecting Potential Price Targets
Extending Fibonacci levels beyond the 100% mark allows traders to project potential price targets for trending markets. These extensions are calculated by multiplying key Fibonacci ratios by the length of the preceding trend. The primary extension levels are:
138.2%
150%
161.8%
200%
By utilizing Fibonacci extensions, traders can gain insights into potential areas where the trend may continue or reverse, enabling them to plan their trading strategies accordingly.

Image: libertex.com
How to Draw Fibonacci Levels in Trading Platforms
Incorporating Fibonacci levels into your trading analysis is a straightforward process. Most trading platforms offer built-in tools for drawing Fibonacci retracements and extensions. Here’s a step-by-step guide:
-
Select the “Fibonacci retracement” or “Fibonacci extension” tool from the platform’s toolbar.
-
Click on the starting point of the trend and drag the cursor to the endpoint.
-
The platform will automatically calculate and display the Fibonacci levels based on your selection.
-
The levels will appear as horizontal lines on your chart, indicating potential areas of support, resistance, or price targets.
Trading with Fibonacci Levels: Practical Applications
Fibonacci levels have proven their worth as valuable indicators for both short-term and long-term trading strategies. Here are a few practical applications:
• Trend Confirmation: Fibonacci levels can provide confirmation of a prevailing trend. If the price repeatedly bounces off a particular Fibonacci level, it suggests that the trend is likely to continue.
• Profit Target Identification: Fibonacci levels can serve as potential profit targets for open trades. Traders can set their targets at key Fibonacci extension levels to lock in gains or limit losses.
• Stop Loss Placement: Fibonacci levels can also guide stop loss placement. By setting a stop loss order just below a support level or just above a resistance level, traders can minimize risk and protect their capital.
• Reversal Identification: Fibonacci retracements can signal a potential trend reversal if the price fails to break through a significant Fibonacci level. Traders can use this information to exit existing trades or initiate counter-trend trades.
How To Read Fibonacci Levels
Conclusion:
Fibonacci levels are a versatile and time-tested tool that enhances market analysis and empowers traders to make informed trading decisions. By comprehending the Fibonacci sequence, discerning retracement and extension levels, and applying these concepts through trading platforms, traders can unlock a powerful toolset for navigating the complexities of the financial markets. Remember, while Fibonacci levels are a valuable indicator, they should be incorporated with other technical and fundamental analysis techniques for a comprehensive trading strategy. Embrace the power of Fibonacci levels and embark on a journey toward financial success.


