Introduction: Fibonacci’s Timeless Connection to Stock Trends
In the realm of finance, where unpredictability often reigns, traders seek reliable patterns to guide their decisions. Among the time-tested tools that have stood the test of time are Fibonacci numbers, a sequence of integers with a unique mathematical property that has fascinated mathematicians and traders alike for centuries. Their appearance in stock charts suggests a hidden order amidst the seemingly chaotic fluctuations, allowing investors to identify potential support and resistance levels, as well as trend reversals.

Image: scanz.com
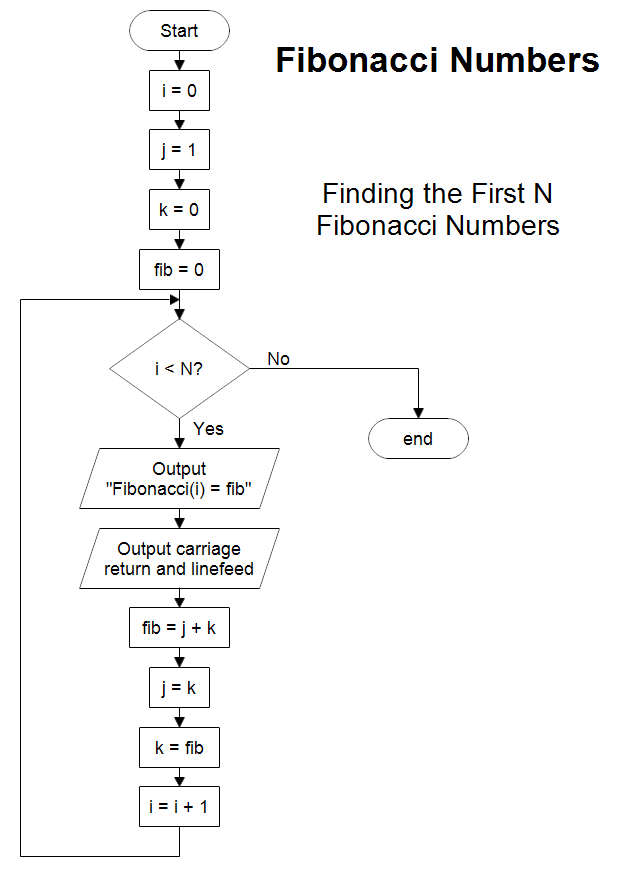
The Fibonacci sequence, named after the renowned Italian mathematician Leonardo Fibonacci, is a series of numbers where each subsequent number is the sum of the two preceding ones. It begins with 0 and 1, followed by 1, 2, 3, 5, 8, 13, 21, 34, and so on. Remarkably, when plotted on a graph, the ratio of successive Fibonacci numbers approaches the famed “golden ratio” of approximately 1.618.
Fibonacci Ratios: Pillars of Technical Analysis
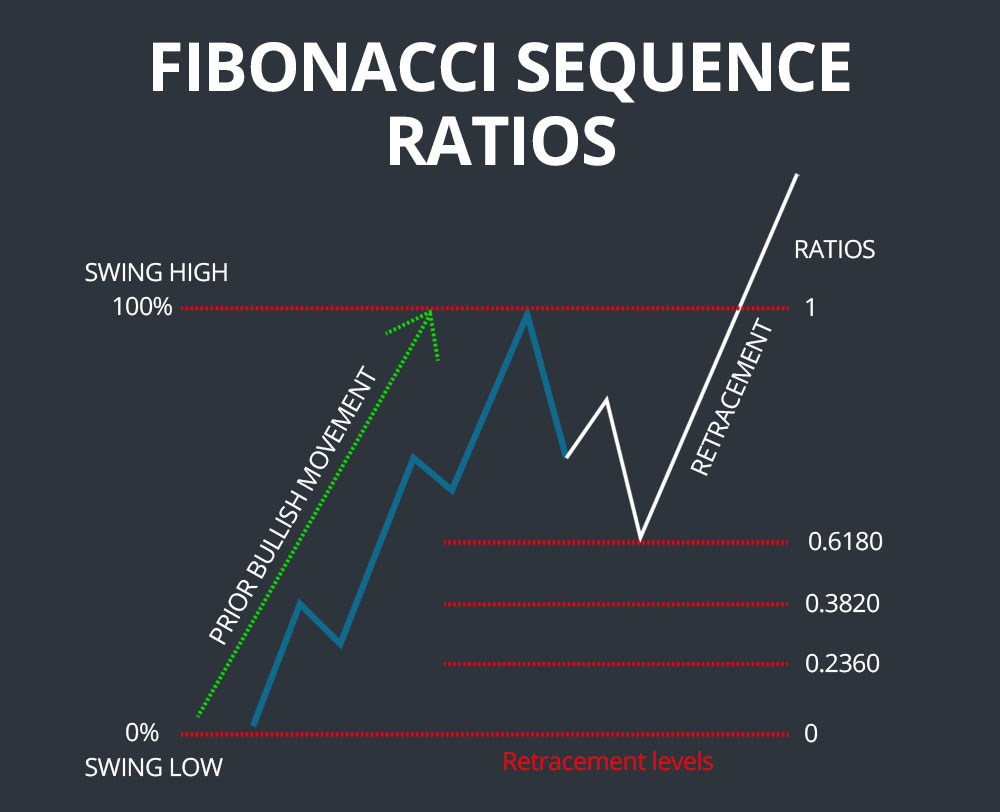
The golden ratio and other key Fibonacci ratios, such as 0.382, 0.500, and 0.618, serve as pivotal levels in technical analysis. Traders believe that prices tend to find support or resistance at these ratios, creating potential buying or selling opportunities. For instance, a price retracing to the 0.382 Fibonacci level may indicate a good entry point for a long position, signifying a potential reversal of the downward trend. Conversely, a price reaching the 0.618 Fibonacci level may suggest a selling opportunity, as it implies a potential retracement or trend reversal.
Retracements, Extensions, and Projections: Decoding Market Movements
Beyond support and resistance levels, Fibonacci numbers also empower traders to identify potential retracements, extensions, and projections. Retracements refer to temporary reversals in the primary trend, typically reaching one of the Fibonacci ratios before resuming the original direction. Extensions, on the other hand, project potential price targets by extending the Fibonacci sequence beyond the initial swing high or low. Projections, similar to extensions, extend Fibonacci levels from a specific point to forecast potential future price levels.
Practical Example: Fibonacci in Action
To illustrate the practical application of Fibonacci numbers, consider a stock chart with an uptrend. If the stock consolidates and retraces, it may find support at the 0.382 Fibonacci level. If the price bounces off this level and continues the uptrend, the 0.618 Fibonacci level could act as a potential target for the rally. Traders may also draw Fibonacci extensions from the swing low to identify potential price objectives.

Image: ihumannetwork.blogspot.com
Cautions and Limitations: Understanding Fibonacci’s Context
While Fibonacci numbers offer valuable insights into market behavior, it’s crucial to exercise caution and consider their limitations. Fibonacci analysis is not a standalone trading strategy and should be used in conjunction with other technical indicators and fundamental analysis. Additionally, Fibonacci levels are not absolute guarantees of future price movements, and traders should be aware of false signals that can occur.
Fibonacci Numbers Stocks
Conclusion: Fibonacci’s Enduring Legacy in Stock Trading
The Fibonacci sequence, with its intrinsic mathematical beauty and practical applications in finance, remains a vital tool in the arsenal of stock traders. By understanding the key Fibonacci ratios and their implications for support, resistance, retracements, extensions, and projections, traders can gain a deeper understanding of market dynamics and make more informed trading decisions. However, it’s essential to approach Fibonacci analysis with a balanced perspective, considering its limitations and supplementing it with other trading strategies for optimal results.


