Forex charts are like a treasure map for traders, revealing valuable insights into market trends and potential trading opportunities. Understanding how to read them accurately is crucial for making informed trades and maximizing profits. Whether you’re a seasoned trader or a novice seeking guidance, this comprehensive guide will equip you with the knowledge and skills to navigate the complexities of forex charts.

Image: www.forex.academy
Deciphering the Forex Market
The foreign exchange market (forex) is where currencies are traded, determining their relative values. Forex charts plot the price movements of currency pairs over time, allowing traders to identify patterns and predict future market behavior. Each currency pair is represented by a three-letter symbol, indicating the base currency (the first) and the quote currency (the second).
Candlesticks: Illuminating Price Action
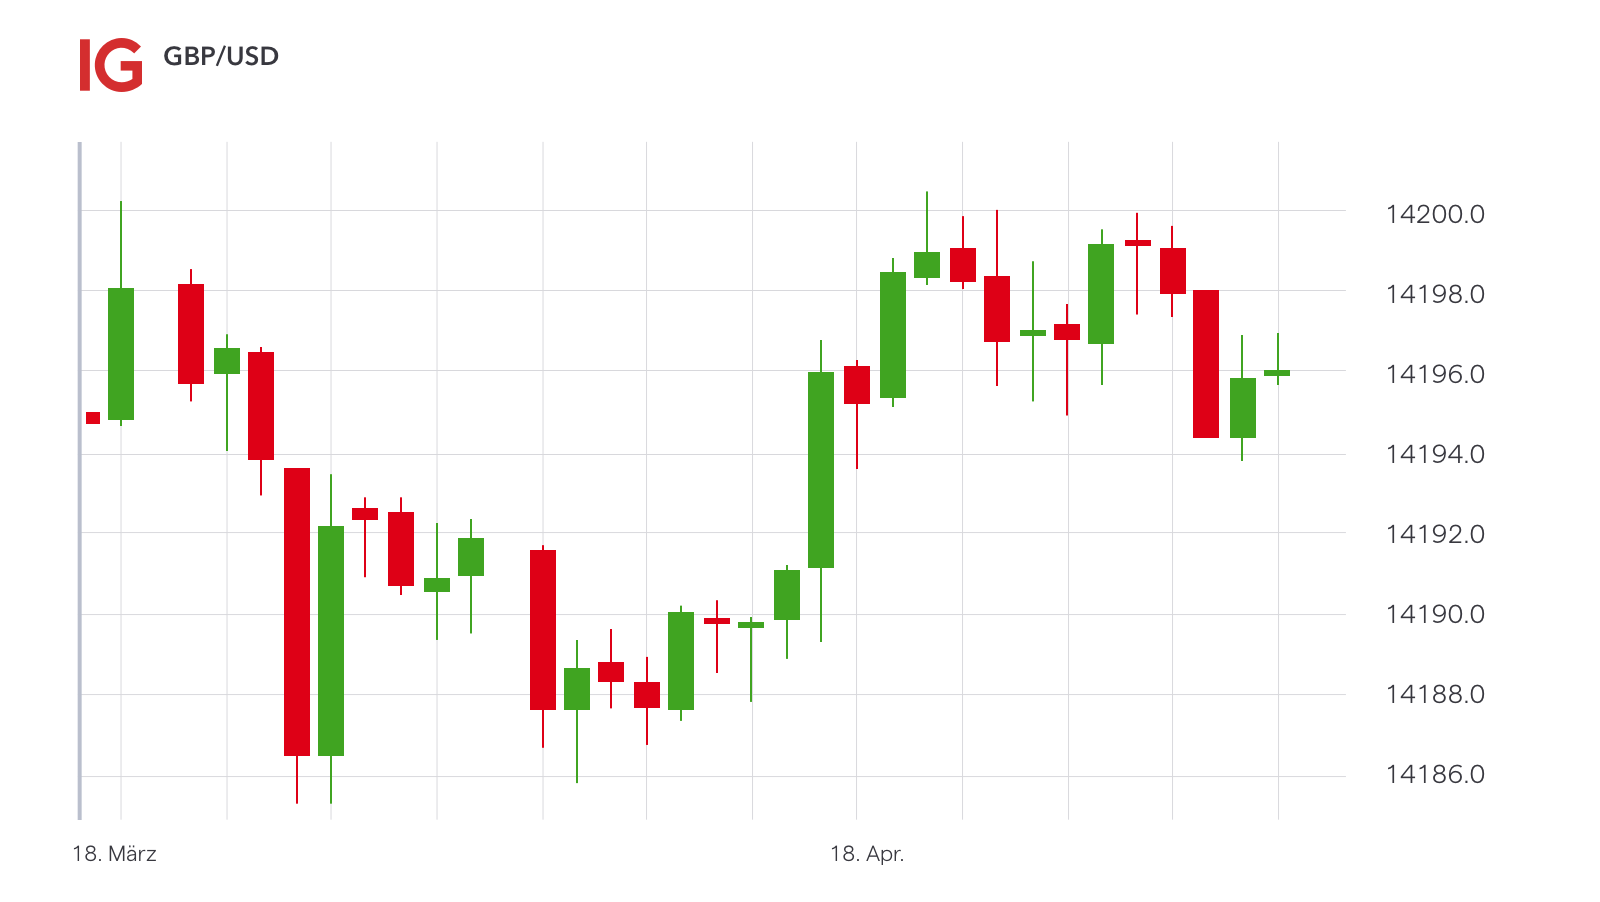
Candlesticks are a popular and intuitive method of visualizing price action on a forex chart. Each candlestick represents a specific period, such as one minute, five minutes, or one hour, depending on the chart’s time frame. The shape of the candlestick reveals crucial information about the price movement:
- Bullish Candlesticks: These have a hollow or white body, indicating an upward price movement.
- Bearish Candlesticks: These have a filled or red body, indicating a downward price movement.
- Shadows: The vertical lines extending above (upper shadow) and below (lower shadow) the body denote the highest and lowest points reached during the period.
Technical Indicators: Enhancing Analysis
Technical indicators are mathematical tools applied to price data to detect trends and identify potential trading opportunities. By analyzing candlestick patterns in conjunction with technical indicators, traders can gain a deeper understanding of market behavior and make more informed decisions.

Image: www.ig.com
Moving Averages: Smoothing Market Noise
Moving averages are a trend-following indicator that smooths out price fluctuations by calculating the average price over a specified period. Different types of moving averages include the simple moving average (SMA), exponential moving average (EMA), and smoothed moving average (SMMA), each with its own advantages and disadvantages.
Relative Strength Index: Measuring Market Momentum
The Relative Strength Index (RSI) is a momentum oscillator that measures the speed and magnitude of price changes. It ranges from 0 to 100, indicating whether the market is overbought (above 70) or oversold (below 30). Traders use the RSI to identify potential trend reversals and trading opportunities.
Expert Tips for Trading Forex
While technical analysis is a valuable skill, it’s not a magic formula for success in forex trading. Combining technical insights with a sound trading strategy and risk management techniques is essential for profitability.
Managing Risk: The Key to Survival
Risk management is the foundation of successful trading. Determine your risk tolerance and set precise stop-loss and take-profit levels to limit potential losses and protect your capital. Risk management involves using stop-loss orders to define the maximum amount you’re willing to lose on a trade and limit orders to execute trades at pre-determined prices.
Frequently Asked Questions
Q: What is the best time frame to use when reading forex charts?
A: The best time frame depends on your trading style and strategy. Higher time frames (e.g., daily, weekly) provide a broader perspective of the market, while lower time frames (e.g., hourly, 5-minute) offer greater detail and opportunities for intraday trading.
Q: How do I identify potential trading opportunities using technical indicators?
A: Technical indicators can generate signals, such as crossovers or divergence, to indicate potential trading opportunities. Combining multiple indicators can improve reliability and offer a more comprehensive view of market conditions.
How Do You Read Forex Charts
Conclusion
Mastering the art of reading forex charts is a journey that requires patience, practice, and continuous learning. By understanding the fundamental concepts, utilizing technical analysis tools, and implementing sound trading strategies, you can empower yourself to navigate the dynamic world of forex and increase your chances of success.
Are you ready to embark on your forex trading adventure? With this comprehensive guide as your compass, you’re equipped to decipher the mysteries of the markets and seize the potential rewards.


