

Have you ever wondered how seasoned traders decipher the intricate dance of stock prices and predict market movements? You’ve likely witnessed those unique, colorful formations on price charts, resembling small candles. These, my friend, are candlesticks – a powerful tool in the arsenal of technical analysis that provides valuable insights into market sentiment and potential price trends.

Image: www.forextime.com
The beauty of candlestick patterns lies in their ability to encapsulate a wealth of information within a single, visually appealing structure. Each candlestick represents a specific timeframe, showcasing the open, high, low, and closing prices of an asset. By understanding the intricacies of these patterns, traders can gain a deeper understanding of market psychology and identify potential buy and sell signals. In this guide, we’ll dive deep into the fascinating world of candlestick trading, exploring their history, core characteristics, and practical applications.
A Journey Through Time: The History of Candlesticks
The fascinating tale of candlestick charting originates in 18th-century Japan, where a rice merchant by the name of Homma Munehisha developed a unique method of tracking rice prices. He recognized that price movements, far from being random, followed distinct patterns and trends. To better visualize these patterns, Homma created a system using candlesticks, which represented the opening, closing, high, and low prices of rice over a specific period. This ingenious innovation not only helped him predict price fluctuations but also revolutionized the way traders approached the market.
Mastering the Basics: Deciphering the Candlestick Anatomy
Each candlestick, though seemingly simplistic, holds a wealth of information. Let’s break down its key elements:
- Body: The central rectangular part of the candlestick represents the difference between the opening and closing prices. If the closing price is higher than the opening price, the candlestick body is white or green (bullish candle), indicating an upward price movement. Conversely, a black or red body (bearish candle) signifies a closing price lower than the opening price.
- Upper Shadow (Wick or Shadow): The thin vertical line extending above the body represents the distance between the highest price reached during the period and the closing price. A long upper shadow suggests selling pressure against an uptrend (resistance).
- Lower Shadow (Wick or Shadow): This vertical line below the body indicates the distance between the lowest price reached and the opening price. Long lower shadows hint at buying pressure against a downtrend (support).
Candlestick Formations: Unveiling the Language of the Market
The real magic of candlestick analysis lies in recognizing patterns formed by multiple candlesticks. These formations, often referred to as candlestick patterns, offer insights into market sentiment, potential reversals, and continuation trends. Here are some key patterns and their implications:
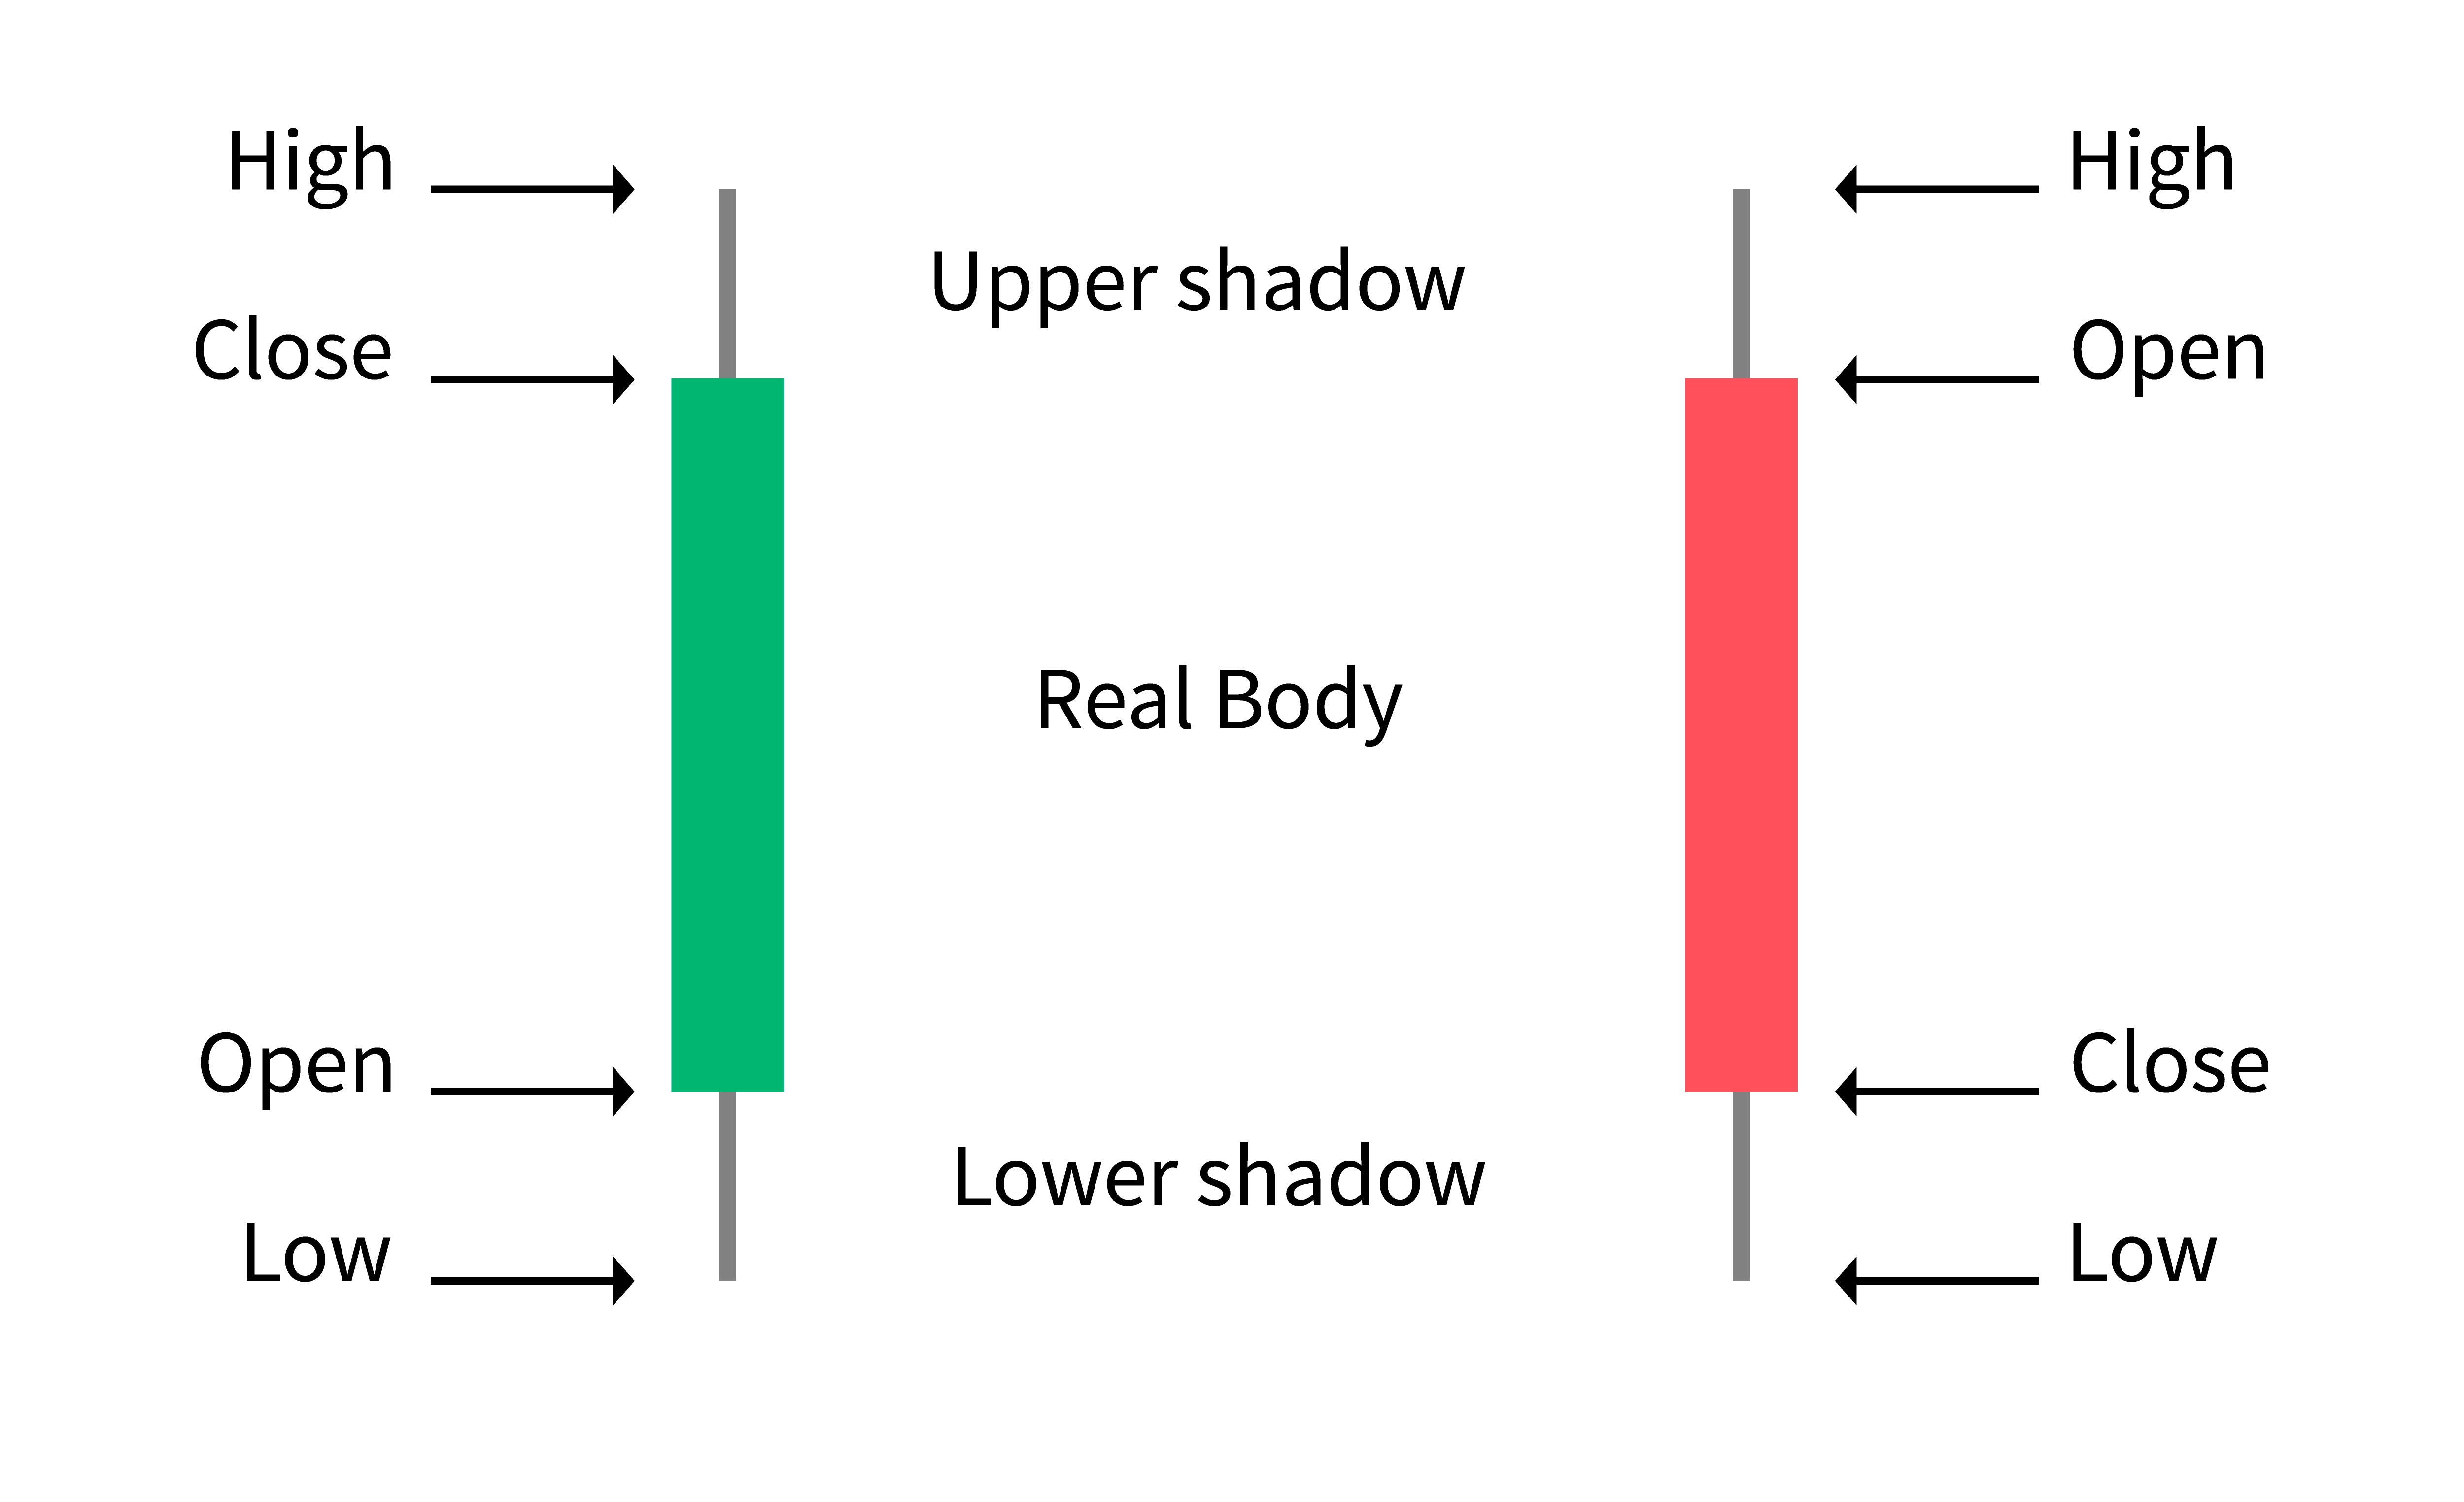
Image: www.jlcatj.gob.mx
1. Bullish Patterns:
These patterns signal a potential upward price movement or a bullish market sentiment.
- Hammer: A single candlestick with a long lower shadow and a small body, suggesting buying pressure at the bottom of a downtrend. It is considered a bullish reversal pattern.
- Morning Star: A three-candlestick pattern consisting of a bearish candle followed by a small-bodied candle and a bullish candle. It signals a potential change in trend from bearish to bullish.
2. Bearish Patterns:
These candlestick formations indicate a possible downward price movement or a bearish market sentiment.
- Shooting Star: A single candlestick with a small body and a long upper shadow, signifying selling pressure near the top of an uptrend.
- Evening Star: Similar to the Morning Star, but reversed, indicating a potential shift from a bullish to bearish trend.
3. Continuation Patterns:
These patterns signal the continuation of an existing trend, meaning the prevailing direction of the market is likely to persist.
- Bullish Engulfing: A two-candlestick pattern where a bullish candle completely engulfs the preceding bearish candle, indicating a strong bullish price movement.
- Bearish Engulfing: This pattern is the opposite of the Bullish Engulfing, where a bearish candle completely engulfs the preceding bullish candle.
The Art of Interpretation: Combining Candlesticks with Other Technical Indicators
While candlestick charting offers a comprehensive view of market dynamics, it’s essential to remember that no single indicator can tell the whole story. To enhance your trading strategy effectively, it’s recommended to use candlestick patterns in conjunction with other technical indicators. For instance, moving averages can provide additional support and resistance levels, while volume analysis can confirm the strength of price action signaled by candlestick patterns.
Trading Candlestick Explained
The Bottom Line: Harnessing the Power of Candlesticks
Candlestick charting is a powerful tool for deciphering market sentiment and identifying potential trading opportunities. By understanding the basic principles of candlestick formation, you can gain valuable insights into market psychology and navigate the dynamic world of trading with greater confidence. But remember, consistency is key. Practice, patience, and continued learning are essential for mastering this valuable skill.
As you embark on your candlestick journey, explore further resources, experiment with different strategies, and don’t be afraid to seek guidance from experienced traders. The world of technical analysis is vast and exciting, and candlestick charting is your gateway to unlocking its hidden treasures. Happy trading!


