Have you ever wondered what separates the software development teams that consistently deliver value from those that struggle to keep up with the demands of the modern digital landscape? The answer lies in understanding and mastering the principles behind DevOps, and perhaps no set of metrics is more influential in this regard than the DORA metrics.

Image: www.gitkraken.com
The DORA (DevOps Research and Assessment) metrics are a set of key performance indicators (KPIs) developed by Google Cloud to assess the effectiveness of software development and delivery processes. They provide a standardized framework for measuring how well organizations are performing in various stages of the software lifecycle, from developing code to deploying it in production. By actively tracking these metrics, organizations can identify areas for improvement and ultimately accelerate their software delivery speed and impact.
The Four Pillars of DORA Metrics: Unveiling the Secrets to High-Performing DevOps
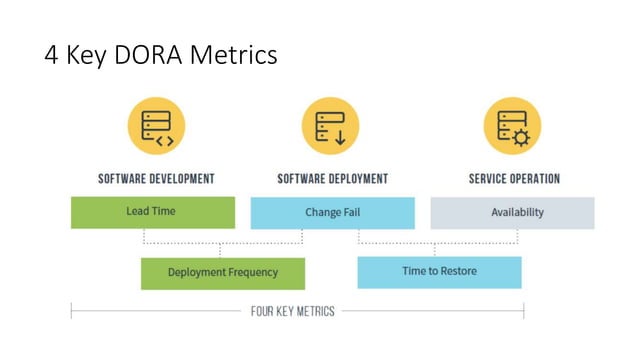
The DORA metrics offer a comprehensive overview of a team’s DevOps performance, encompassing four fundamental pillars:
1. Deployment Frequency: The Speed of Software Delivery
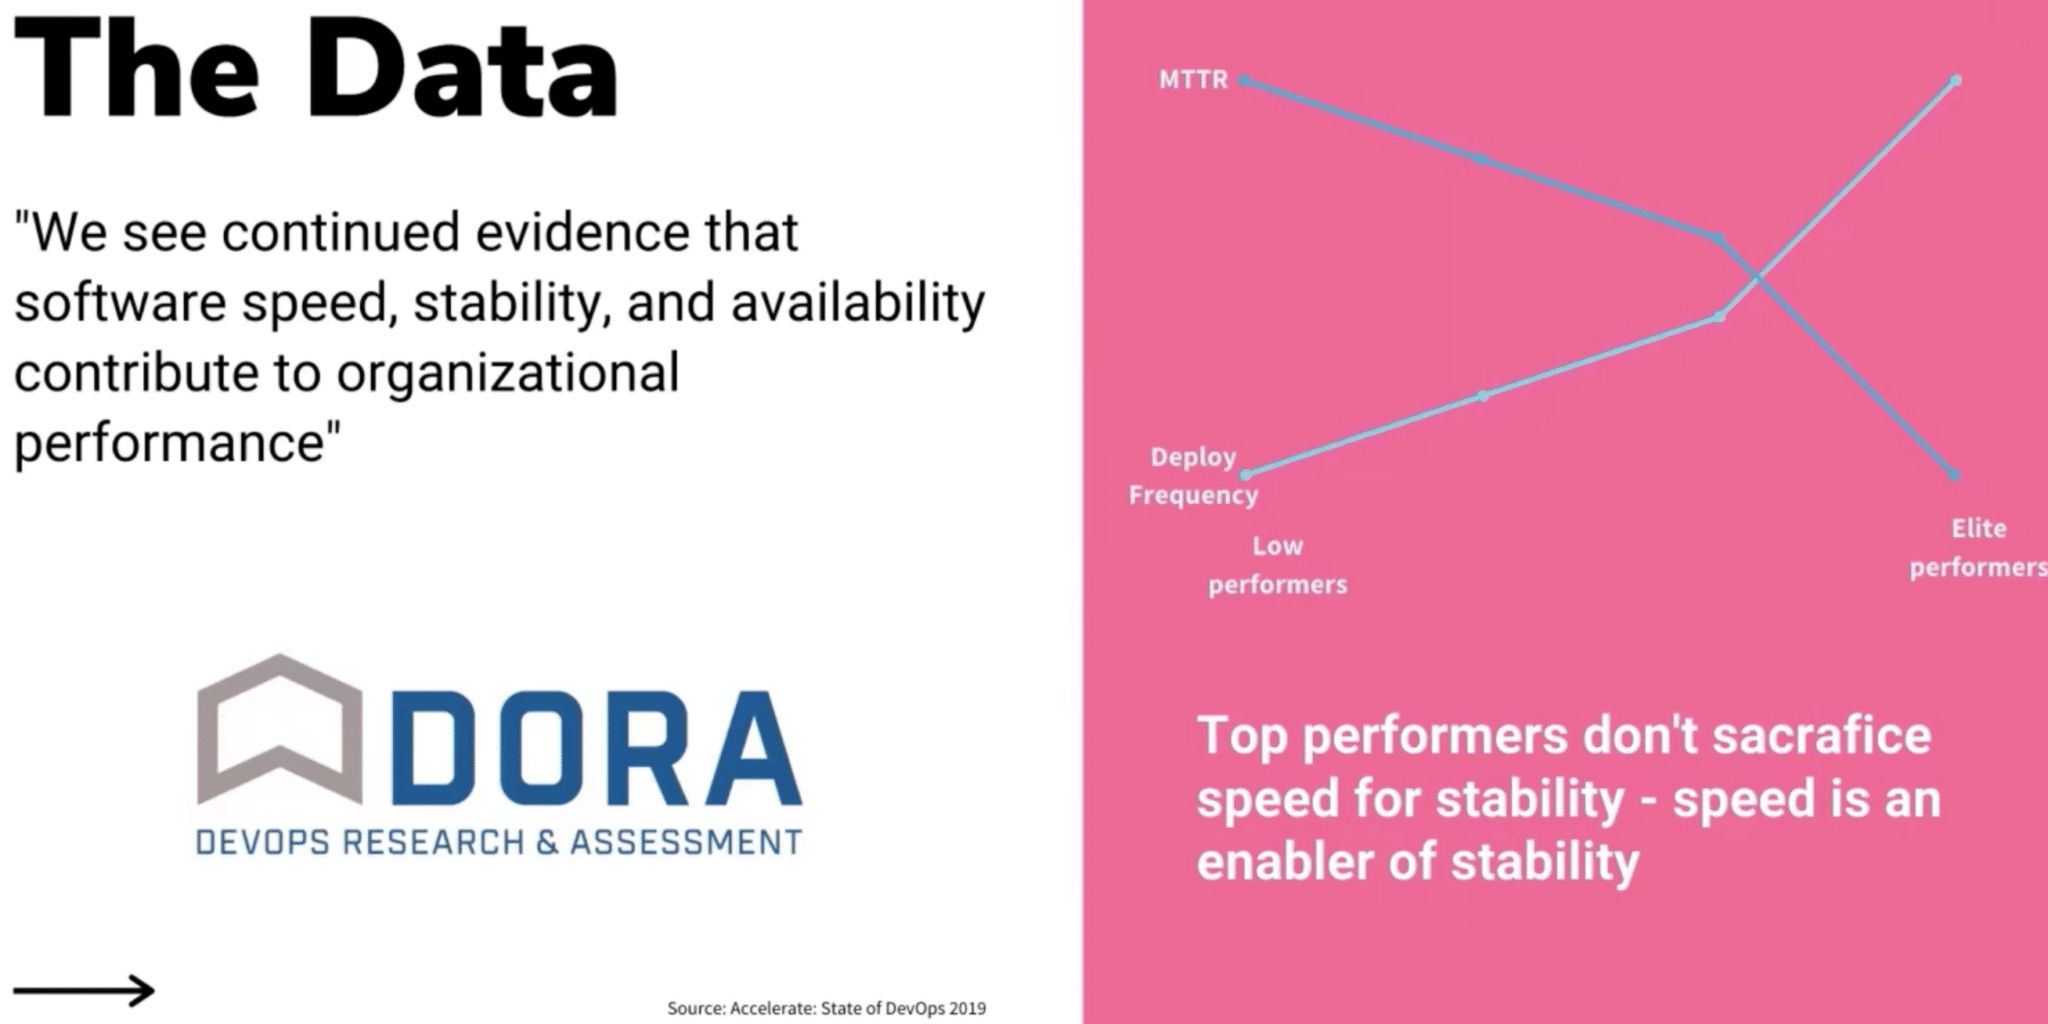
Deployment frequency measures how often an organization successfully deploys new code to production. This metric is a direct indicator of an organization’s ability to deliver value to users quickly. High deployment frequency usually translates to faster delivery cycles, which allows companies to respond more rapidly to customer demands and stay ahead of the competition. A team deploying code multiple times a day is generally considered a high performer, while those deploying only once a month or even less frequently might struggle to keep pace with modern market demands.
2. Lead Time for Changes: From Code to Production
Lead time for changes is the time elapsed between the moment a change is committed to the code base and the moment it reaches production. This metric highlights the overall efficiency of the software delivery process, reflecting the time spent on testing, reviewing, and integration. A shorter lead time indicates a more streamlined workflow, minimizing delays and speeding up the delivery of new features and bug fixes. Organizations striving for high performance aim for lead times measured in hours or days, but many still operate with lead times of weeks or even months.

Image: www.slideshare.net
3. Mean Time to Restore (MTTR): Resilience in the Face of Failure
MTTR measures the average time required to recover from a service outage. This metric highlights an organization’s ability to quickly resolve issues and minimize downtime. A low MTTR signifies a resilient system, ensuring minimal disruption to users. High-performing teams usually have MTTRs measured in minutes, while others can experience hours or even days of downtime during incidents.
4. Change Failure Rate: The Efficiency of Software Deployment
Change failure rate is the percentage of deployments that result in production issues requiring a rollback or remediation. This metric reflects the overall stability of a system and the effectiveness of testing and quality assurance processes. A low change failure rate indicates a high-quality deployment process, leading to fewer issues and less time spent fixing errors. Organizations aspiring to high performance target change failure rates below 15%, while those struggling with stability may experience rates exceeding 50%.
The Power of DORA Metrics: Beyond Just Measurement
While DORA metrics provide a valuable framework for assessing DevOps performance, their true power lies in their capacity to catalyze improvement. By establishing baselines for these metrics and tracking them over time, organizations can identify specific areas requiring attention and develop strategies to optimize their delivery processes.
For example, a high change failure rate might indicate a need for enhanced testing procedures or more rigorous code reviews. Similarly, a long lead time for changes could point to bottlenecks in the development workflow, requiring process streamlining or tool automation. By analyzing trends in DORA metrics, organizations can proactively address these challenges and drive continuous improvement in their DevOps performance.
The DORA Metrics in Action: Real-World Examples
The DORA metrics find widespread application across diverse industries, motivating organizations to adopt DevOps principles and reap the benefits. Here are some inspiring examples:
1. Netflix: The Power of Continuous Deployment
Netflix, with its phenomenal success in streaming entertainment, is a prime example of an organization that embraces DevOps practices with exceptional proficiency. Their rapid release cycles and focus on automation enable continuous delivery, allowing them to roll out new features and optimize their platform with unparalleled agility. Netflix is notorious for making updates several times a day with a low change failure rate, showcasing the power of their well-structured DevOps processes.
2. Amazon: The DevOps Advantage in E-Commerce
Amazon, a global powerhouse in e-commerce, utilizes DevOps principles to maintain its reputation for reliable and efficient operations. Their commitment to continuous integration and delivery enables them to rapidly deploy new features and respond to evolving customer preferences. Through a robust DevOps framework and a strong focus on automation, Amazon achieves high deployment frequency, reduced lead time, and a low change failure rate, demonstrating the immense impact of embracing these practices.
The Future of DORA Metrics: Embracing Continuous Improvement
The DORA metrics are not static. As the digital landscape evolves and DevOps best practices continue to refine, so too will the DORA metrics evolve to reflect these advancements. New metrics and variations are likely to emerge, reflecting the ever-changing nature of software development and delivery.
One such example is the introduction of metrics focusing on measuring the impact of software deployments on business outcomes, such as customer satisfaction, revenue generation, or user engagement. These metrics aim to move beyond just measuring efficiency and look at the broader impact of software delivery on organizational goals.
As DevOps practices continue to mature and the demands of the digital world accelerate, it is essential for organizations to embrace continuous improvement and adapt their approach to software development and delivery. The DORA metrics provide a valuable foundation for this journey, offering a structured framework for measurement, analysis, and optimization.
Dora Devops Metrics
Conclusion: Unleashing the Potential of DORA Metrics
By focusing on the four key pillars of deployment frequency, lead time for changes, mean time to restore, and change failure rate, the DORA metrics offer a powerful tool for measuring and driving DevOps performance. Understanding these metrics and actively tracking them allows organizations to identify bottlenecks, streamline processes, and ultimately accelerate their software delivery capabilities. As the digital world continues to evolve, embracing the power of DORA metrics becomes increasingly critical for organizations seeking to thrive and maintain a competitive edge in the modern technology landscape.
Ready to embark on the journey to high-performing DevOps? Start by analyzing your existing processes, benchmark your metrics, and identify areas for improvement. With the DORA metrics as your guide, you can unlock the full potential of your software delivery teams and transform your organization into a high-performing technology powerhouse.


