Picture yourself as a skilled trader, meticulously navigating the ever-shifting market landscape. With each trade, you make strategic decisions, anticipating market movements and aiming for that elusive profit margin. But what if you could test your trading strategies without risking real capital? Enter the world of trade simulators—powerful tools that empower you to refine your skills and track your progress.

Image: www.forexyields.com
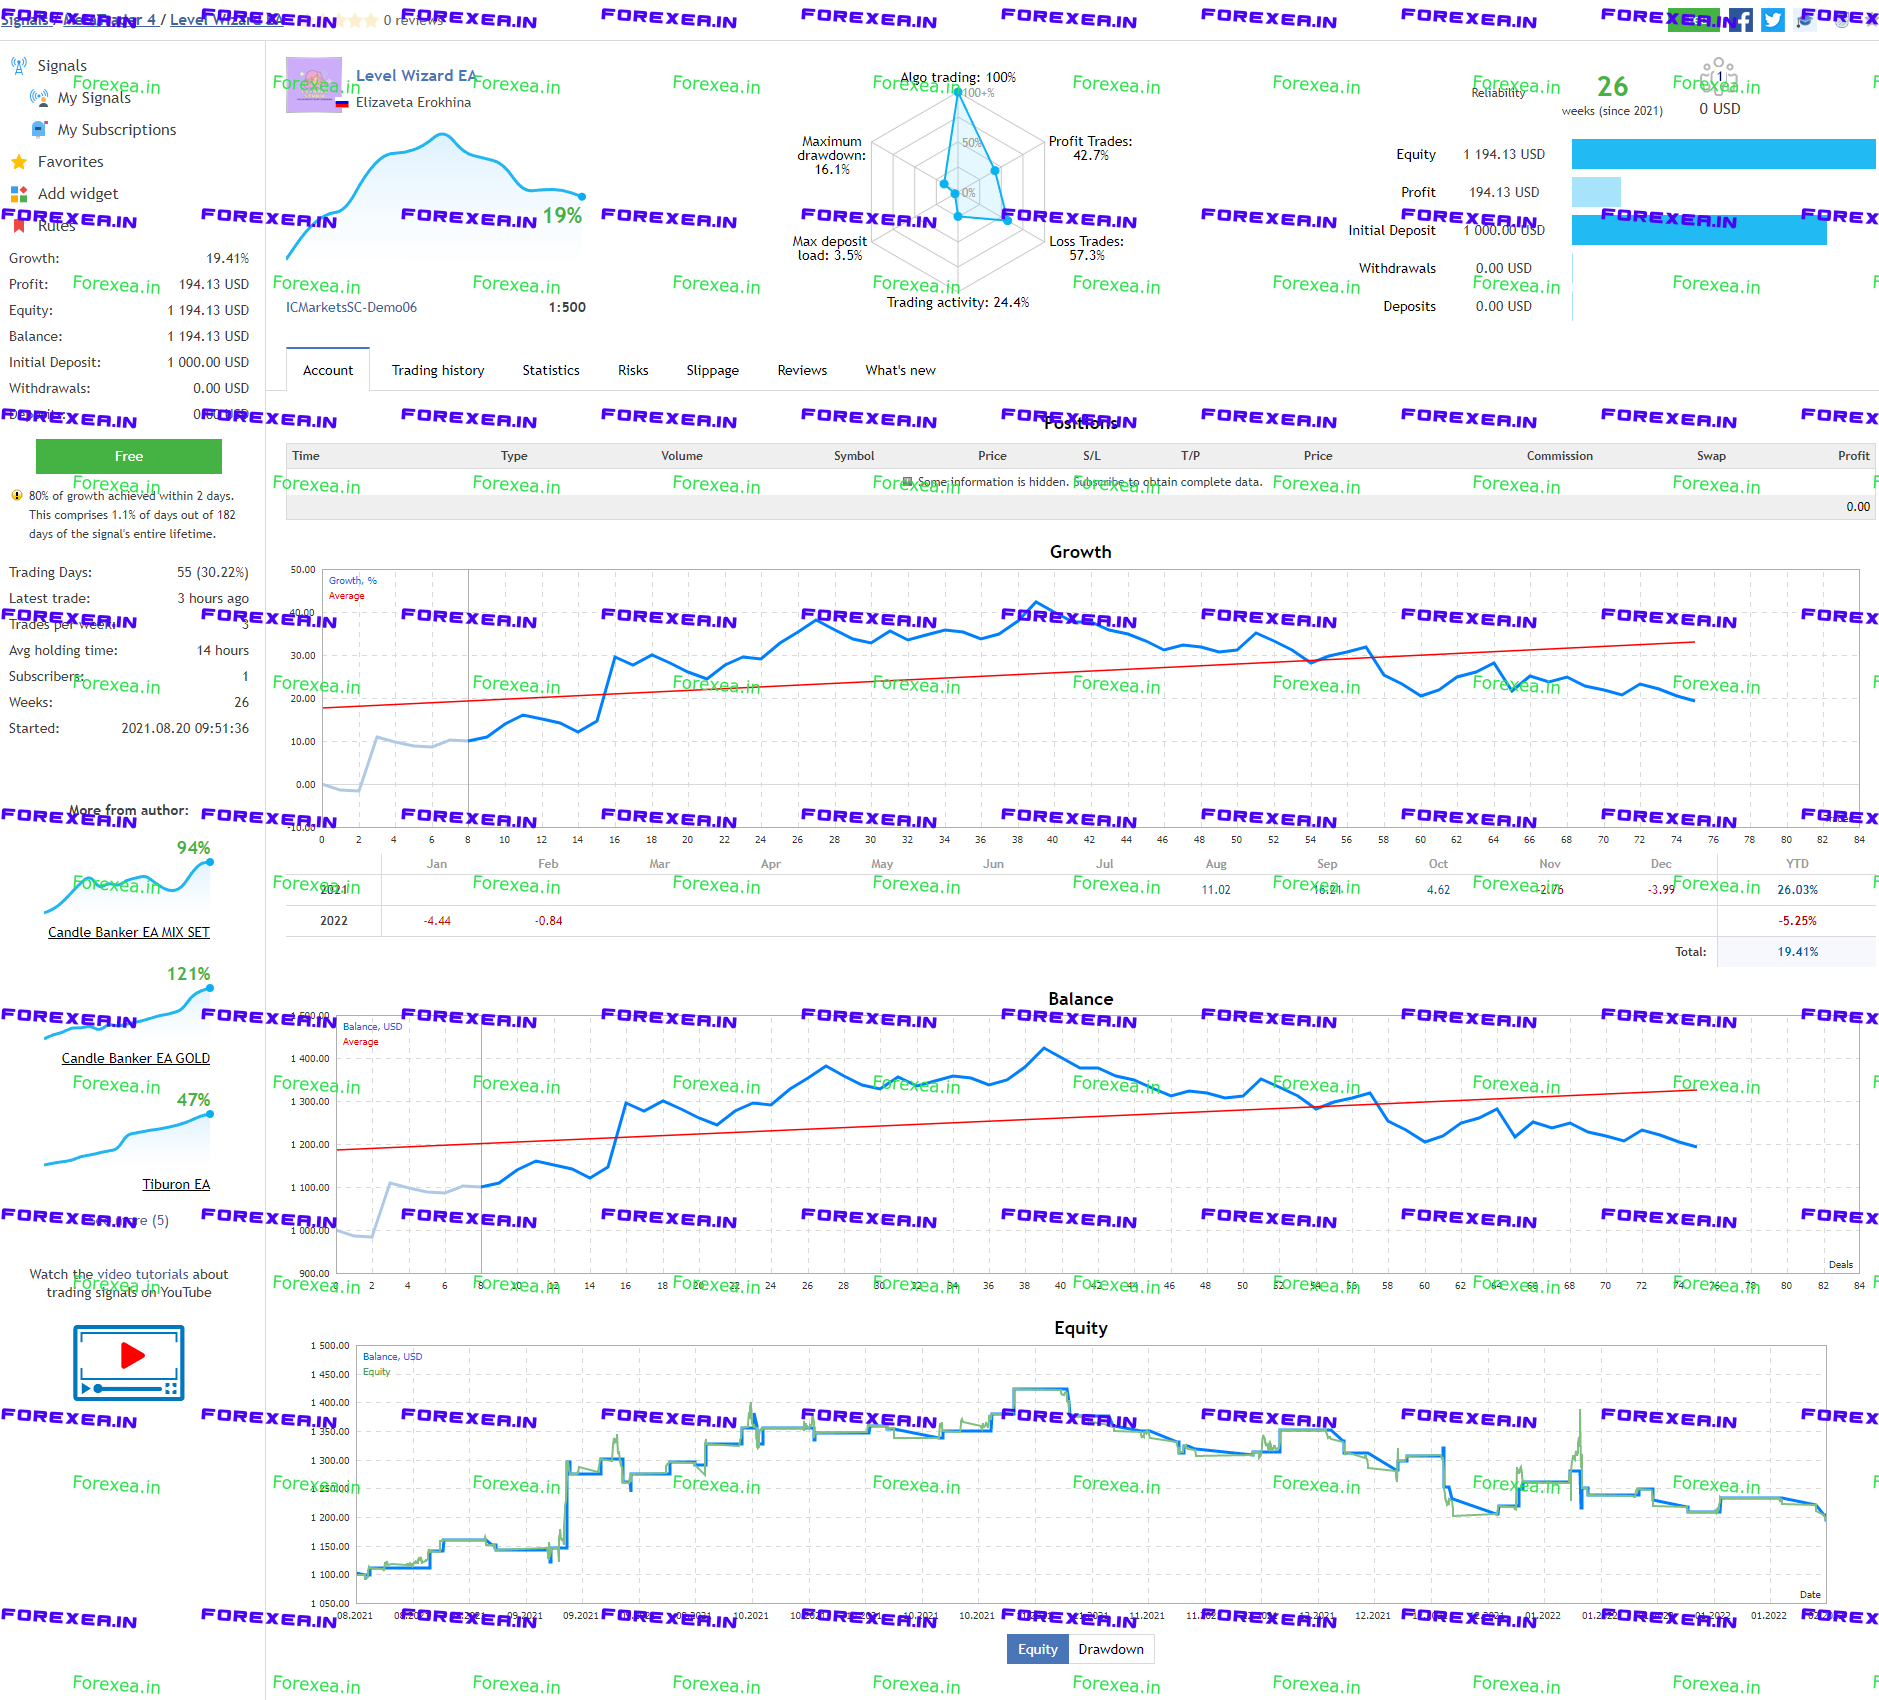
Among the numerous trade simulators available, one stands out for its simplicity and effectiveness: Excel. Yes, the ubiquitous spreadsheet application can be transformed into a robust trade simulator with a few clever formulas and charts. And it’s all about monitoring your equity curve—a graphical representation of your trading performance over time.
The Significance of the Equity Curve
Your equity curve is the heartbeat of your trading journey. It reveals your progress, identifies areas for improvement, and serves as a constant reminder of the risks involved. By diligently tracking your equity curve, you gain valuable insights into:
- Your overall profitability (or losses)
- Periods of growth and decline
- The impact of different trading strategies
- Your tolerance for risk
Armed with this knowledge, you can fine-tune your approach, identify weaknesses, and make informed decisions to maximize your trading success.
Crafting Your Excel Trade Simulator
Creating an Excel trade simulator is surprisingly straightforward. Begin by setting up a simple spreadsheet with columns for the following:
| Column Name | Description |
|---|---|
| Date | Date of each trade |
| Symbol | Currency pair traded |
| Type | Buy or sell order |
| Entry Price | Price at which you entered the trade |
| Exit Price | Price at which you exited the trade |
| Profit/Loss | Profit or loss generated from each trade |
| Equity | Your cumulative equity balance after each trade |
Next, you’ll need to apply formulas to calculate profit/loss and equity. For Profit/Loss, simply subtract the Entry Price from the Exit Price and multiply by the trade size. For Equity, sum the profit/loss from all previous trades and add it to your initial equity balance.
Analyzing Your Equity Curve
With your trade simulator up and running, you can start logging your trades and monitoring your equity curve. Here are some key factors to analyze:
- Trend and direction: Is your equity curve trending upwards, indicating overall profitability, or downwards, signaling losses?
- Volatility and drawdowns: Does your equity curve exhibit sharp swings or gradual fluctuations? How deep are the drawdowns (periods of decline)?
- Consistency: Are there sustained periods of growth or loss? Or is your equity curve erratic and unpredictable?
- Risk profile: How much risk are you taking? Are you risking too much, leading to large drawdowns? Or are you being too conservative, limiting your potential returns?

Image: emugepavo.web.fc2.com
Tips for Successful Trading
As you delve into simulated trading, consider these timeless tips from seasoned traders:
- Backtest your strategies: Test your trading strategies using historical data before applying them to live trading.
- Manage your risk: Establish clear risk management parameters to avoid large losses.
- Stay disciplined: Adhere to your trading plan and avoid emotional decision-making.
- Learn from losses: Analyze your mistakes and use them as learning opportunities to improve.
- Seek support: Join trading communities or consult with experienced mentors for guidance and insights.
Frequently Asked Questions
Q: Is an Excel trade simulator reliable?
A: Excel trade simulators can provide valuable insights into your trading performance, but they should not be used as the sole basis for decision-making. They are simulations and do not account for real-world market conditions.
Q: Can I use my Excel simulator to predict future market moves?
A: No, trade simulators cannot predict the future. They are only tools for analyzing past performance and developing trading strategies.
Q: How much experience do I need to use an Excel trade simulator?
A: Excel trade simulators are suitable for both experienced and novice traders. They can help you refine your skills and develop strategies.
Trade Simulator Forex Equity Curve Excel
Conclusion
Embarking on a trading journey is an exciting and challenging endeavor. By leveraging the power of Excel as a trade simulator, you can gain valuable insights into your trading performance, identify areas for improvement, and refine your skills without risking real capital. Remember, the key to successful trading lies in understanding your strategies, managing your risk, and embracing continuous learning.
Ready to elevate your trading to new heights? Embrace the world of Excel-based trade simulators and start tracking your progress towards financial freedom. The journey awaits—are you ready to take the leap?


