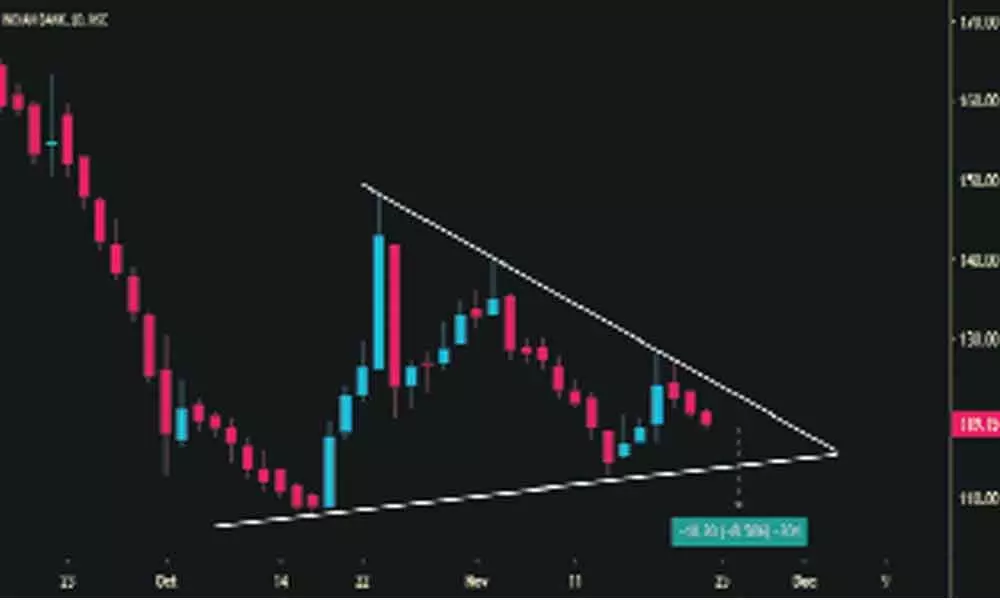
Ever felt lost in the swirling vortex of financial data, unable to decipher the intricate dance of market movements? You’re not alone. The world of trading can feel overwhelming, especially for those just starting out. But fear not, because within the sophisticated realm of technical analysis lies a treasure trove of insights – one that can be unlocked through the powerful and user-friendly platform known as TradingView.com.

Image: www.thehansindia.com
Imagine having access to a comprehensive and interactive toolkit, filled with customizable charts, real-time market data, and an array of technical indicators. Imagine being able to analyze market trends, identify trading opportunities, and refine your trading strategies – all within a single, intuitive platform. That’s the power of TradingView.com, a platform that goes beyond simply displaying charts; it empowers you to truly understand the language of the markets.
Navigating the Charts: A Journey of Discovery
Let’s embark on a journey through the TradingView chart interface, unraveling its hidden treasures and uncovering the secrets it holds. At its core lies the chart itself, a powerful visual representation of price movements over time. TradingView allows you to customize it to your heart’s content, adjusting settings like:
- Timeframe: From minute-by-minute tick data to daily, weekly, and even monthly charts, you can choose the timeframe that best suits your trading style and analysis needs. This allows you to view market trends across different time scales, revealing patterns that might be obscured at shorter intervals.
- Chart Type: Explore different chart types, such as candlestick charts, line charts, and bar charts, each offering unique perspectives on price action. Experiment with each type to understand the information they convey and find the type that resonates with your analytical approach.
- Indicators: TradingView offers a vast library of technical indicators, each built to highlight specific market dynamics. From moving averages and MACD (Moving Average Convergence Divergence) to Bollinger Bands and the Relative Strength Index (RSI), these indicators provide valuable insights into momentum, overbought/oversold conditions, and potential trend reversals. The key is to understand what each indicator measures and how it can be used to support your trading decisions, rather than relying solely on its signals.
Crafting Your Trading Strategy: A Symphony of Indicators
The true magic of TradingView emerges when you weave together various indicators to create a comprehensive trading strategy. Imagine this: you’re analyzing a candlestick chart, looking for a potential breakout. But you want to be extra cautious, so you overlay a moving average indicator to identify the current trend. To gain further insight, you add the RSI indicator to gauge the market’s momentum, looking for signs of oversold or overbought conditions. Finally, Bollinger Bands help you assess the price volatility, suggesting potential entry and exit points. This synergistic approach, where you integrate several indicators, creates a holistic perspective that empowers you to make well-informed trading decisions.
Beyond the Chart: A Collaborative Trading Community
TradingView isn’t just a charting platform; it’s a dynamic community of traders from all walks of life. This vibrant online network connects you with other market enthusiasts, allowing you to:
- Share Ideas: Post your insights and technical analysis, sparking discussions and exchanging perspectives with fellow traders. This collaborative exchange of ideas fosters a learning environment where you can refine your knowledge and gain valuable insights.
- Follow Experts: Discover a wide range of renowned analysts and traders, their profiles showcasing their expertise and trading strategies. Follow their trading ideas, learn from their insights, and gain inspiration for your own approaches.
- Explore Strategies: Delve into the public library of trading strategies, created and shared by the community. Learn from seasoned traders, study their tactics, and adapt them to your own trading style.

Image: www.tradingview.com
Advanced Features: Unlocking Deeper Insights
While TradingView is accessible for beginners, it also offers a suite of advanced features catering to experienced traders. These features include:
- Pine Script: This scripting language allows you to create your own custom indicators, strategies, and alerts. This empowers you to create personalized tools that align precisely with your analytical preferences and trading style, tailoring the platform to your specific needs.
- Backtesting: Test your trading strategies against historical market data to gauge their performance and effectiveness. Backtesting allows you to refine your strategies before deploying them in real-world markets, minimizing risk and maximizing your chances of success.
- Paper Trading: Experience the thrill of trading in a simulated environment, allowing you to practice your skills and test your strategies without risking real funds. This is a valuable tool for honing your trading craft and building confidence before taking the plunge in live markets.
Staying Ahead of the Curve: News and Market Insights
TradingView goes beyond charts and technical analysis, offering a wealth of market insights and news to keep you informed. Its news feed aggregates real-time updates from various sources, including financial news outlets and social media platforms. This allows you to stay abreast of market-moving events and news releases that can potentially influence price movements.
The Future of Trading: Embracing Innovation
TradingView is constantly evolving, embracing new technologies and features to enhance its user experience. Expect to see ongoing improvements in features like:
- AI-powered insights: Utilizing artificial intelligence to generate automated trading signals and provide personalized recommendations.
- Integrated social media: Seamlessly connecting with trading communities and social media platforms to facilitate faster information flow and idea sharing.
- Virtual reality and augmented reality: Immersive trading experiences that allow you to visualize market data and analyze charts in a more interactive environment.
Trading View.Com Chart
Conclusion: A Powerful Tool for Informed Traders
TradingView has become an indispensable tool for traders worldwide. Its intuitive interface, comprehensive features, and thriving community empower you to navigate the complex world of markets with confidence. Whether you’re a seasoned veteran or just starting out, TradingView offers a platform that can help you learn, analyze, and refine your trading strategies. Embrace the power of this platform, delve into the world of technical analysis, and unlock the secrets of informed trading.


