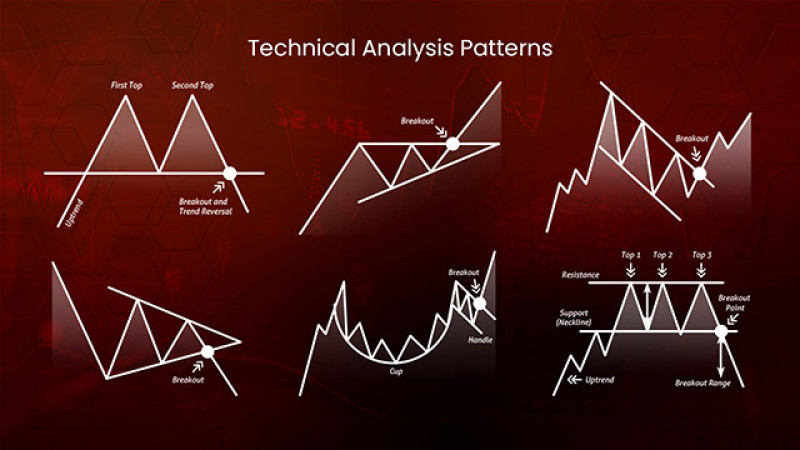
Imagine a world where you could predict the future of the market, not by relying on pure speculation but by reading the subtle signals hidden within price charts. That’s the power of technical analysis, a tool that empowers traders to gain an edge in the ever-turbulent world of finance. And the key to unlocking this power lies in learning to decipher those cryptic patterns that emerge on the charts – patterns that tell a compelling story, a story of market sentiment and future price movements. This is where technical analysis patterns come in; they are the language of the markets, whispering secrets to those who know how to listen.

Image: www.ifxbank.com
Technical analysis patterns are not just random squiggles on a chart. They are the fingerprints of collective market behavior, reflecting the emotions, hopes, and fears of countless traders. Whether the market is surging upwards or plummeting downwards, there’s always a logic, a pattern, a rhythm to its movements. By understanding these patterns, you can take advantage of opportunities others might miss, potentially turning the tide in your favor.
Delving into the Depths of Technical Analysis Patterns
The world of technical analysis patterns is vast and complex, but it’s fundamentally about recognizing recurring shapes and formations on price charts. These patterns are believed to provide valuable insights into the direction and momentum of a security’s future price movements.
-
Trendlines: Perhaps the most basic – yet powerful – tool in the technical analyst’s arsenal. Trendlines are drawn to connect a series of price highs or lows, establishing a directional bias for the market. An upward sloping trendline suggests bullish momentum, while a downward sloping trendline signals bearish sentiment.
-
Support and Resistance: These levels represent price points where buying or selling pressure tends to be strong. Support levels act as a floor, preventing prices from falling below them, while resistance levels act as a ceiling. When prices approach these levels, traders often anticipate a reversal in direction, creating opportunities for profit.
-
Candlestick Patterns: These unique patterns, named after the Japanese candlesticks they resemble, provide insights into price action and sentiment. Each candlestick’s body and wicks – the upper and lower shadows – depict the opening, closing, high, and low prices of an asset during a specific time period. These patterns can be incredibly evocative, like the “Hammer” signaling a potential bullish reversal or the “Shooting Star” hinting at a bearish reversal.
-
Chart Patterns: These formations encompass a larger time frame than candlestick patterns, often spanning weeks or months and providing a broader perspective. Common chart patterns include:
-
Head and Shoulders: A common reversal pattern that suggests a change in the prevailing trend. It’s characterized by a “head” formed by a peak, followed by two smaller peaks, resembling shoulders on each side.
-
Double Top/Double Bottom: Similar to the “Head and Shoulders” pattern, these formations mark potential reversals. In a “double top” pattern, two peaks form at the same price level, followed by a decline. A “double bottom” is the inverse, with two troughs at the same level foreshadowing a potential price rise.
-
Triangles: These patterns tend to signify periods of consolidation where the market is struggling to break out of a range. They can be ascending, descending, or symmetrical, offering insight into the potential breakout direction.
-
Understanding the Psychology Behind the Patterns
The beauty of technical analysis lies not just in the patterns themselves, but in the psychology behind them. These patterns are a reflection of the collective actions of many participants – a confluence of greed, fear, optimism, and pessimism that drives the market’s movements.
For example, a breakout from a “Head and Shoulders” pattern suggests that the selling pressure has been exhausted, and the bulls are gaining control. Conversely, a breakdown from an “Ascending Triangle” pattern indicates that the bullish momentum has faltered, and bears are gaining ground.
Mastering the Art of Trading with Technical Analysis Patterns
Technical analysis patterns are an invaluable tool, but they are not foolproof. Successful traders understand that market patterns are rarely perfect, and interpreting them requires experience and judgment.
-
Embrace Diversification: Don’t rely on a single pattern for all your trading decisions. Diversify your strategies, using multiple patterns, indicators, and other tools to confirm your analysis.
-
Consider Market Context: Technical analysis patterns work best within a broader market context. Consider the overall sentiment, economic conditions, and news events that could influence the pattern’s validity and interpretation.
-
Practice Patience: Learning to identify and interpret technical analysis patterns takes time and practice. Begin with simple patterns and gradually expand your knowledge as you become more comfortable.
-
Respect Stop-Loss Orders: Markets can be unpredictable. Even the most well-crafted analysis can be wrong. Always use stop-loss orders to manage your risk and minimize potential losses.

Image: meghainvestments.blogspot.com
Technical Analysis Patterns
The Future of Technical Analysis: A Constant Evolution
The world of finance is constantly evolving, and so is technical analysis. New platforms, tools, and methodologies are being developed to refine our understanding of market behavior and enhance our ability to predict future price movements.
As we venture further into the digital age, the role of artificial intelligence (AI) and machine learning (ML) in technical analysis is becoming increasingly prominent. These technologies can process vast amounts of data in real-time, identifying patterns and generating insights that might escape human comprehension.
The future of technical analysis is bright with possibilities, and it all begins with mastering the basics – understanding those unique, often subtle patterns that whisper the secrets of the market. Armed with this knowledge, you can embark on your own journey of exploration, unlocking the powerful language of charts and navigating the ever-changing landscape of finance.


