As an avid trader, I stumbled upon the enigmatic world of candlestick patterns during a pivotal trading day. The intricate shapes and movements of these candlesticks captivated my attention, revealing a hidden language etched into the price charts. Ever since that day, I’ve embarked on a relentless quest to decipher their secrets, unlocking the mysteries behind market sentiment and price movements.

Image: www.jlcatj.gob.mx
Join me on this enlightening journey as we delve into the fascinating realm of candlestick patterns. Let’s ignite our trading prowess and unravel the invaluable insights they hold for discerning traders.
Candlestick Patterns: The Art of Price Communication
Candlestick patterns are visual representations of price action over a specific period, typically a day, a week, or a month. These patterns are formed by the interplay of the open, close, high, and low prices within a trading session. By interpreting the unique configurations and relationships between these candlesticks, traders gain a deeper understanding of market sentiment and potential price movements.
First developed by the legendary Japanese rice trader Munehisa Homma in the 18th century, candlestick patterns have stood the test of time, providing invaluable insights for traders across centuries. Today, they remain a cornerstone of technical analysis, empowering traders to navigate market volatility and make informed trading decisions.
Unveiling the Meaning of Candlestick Patterns
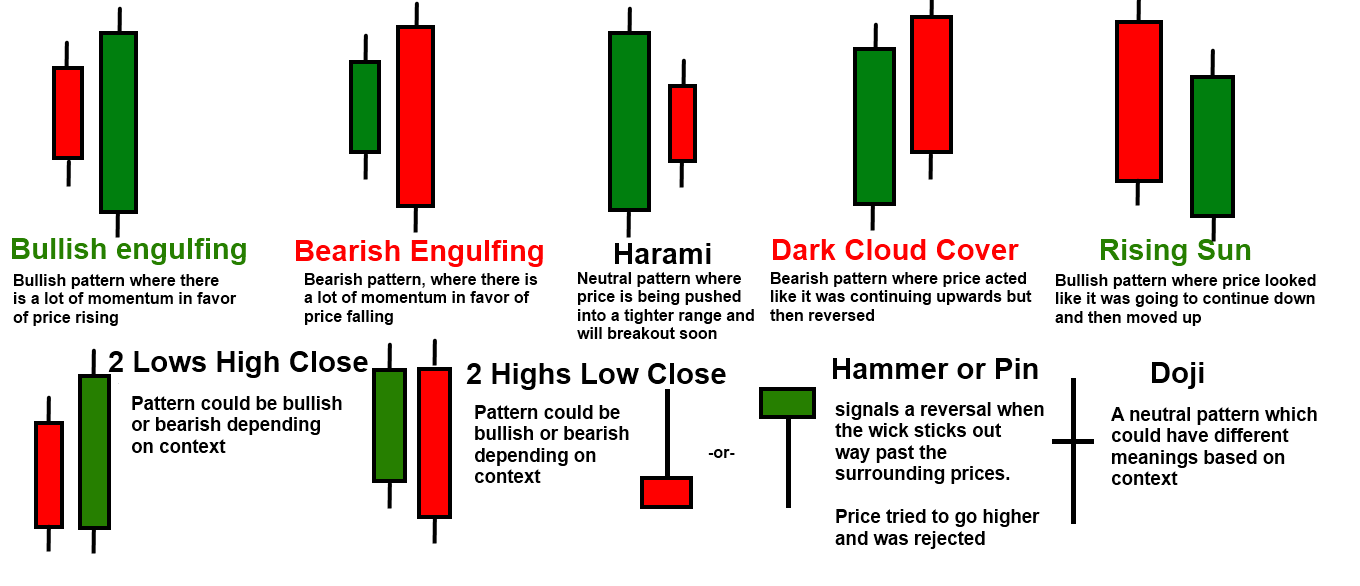
Candlestick patterns encompass a diverse range of formations, each conveying a distinct message about market sentiment. Bullish patterns, characterized by long green candlesticks and minimal shadows, signal upward momentum and buying pressure.
Conversely, bearish patterns, featuring long red candlesticks and pronounced shadows, indicate a downtrend and selling pressure. Doji candlesticks, with small bodies and extended wicks, signify indecision and uncertainty within the market, often leading to consolidations or reversals.
Identifying Candlestick Patterns: A Trader’s Guide
Mastering candlestick patterns requires discerning observation and a keen eye for detail. By scrutinizing the interplay of the four price components, traders can identify a wide range of patterns, each with its own implications for market direction.
Among the most common and reliable patterns are the bullish engulfing pattern, characterized by a large green candlestick that completely engulfs the previous red candlestick, indicating a reversal from downtrend to uptrend. The bearish engulfing pattern, on the other hand, is formed when a large red candlestick engulfs the preceding green candlestick, signaling a shift from uptrend to downtrend.

Image: balidarelo.weebly.com
Beyond the Basic Patterns: Exploring Advanced Formations
The realm of candlestick patterns extends beyond the fundamental bullish and bearish patterns. Advanced formations, such as the evening star, morning star, and three white soldiers, offer even more precise insights into market behavior.
The evening star pattern, a bearish reversal pattern, consists of three candlesticks: a long green candlestick, a smaller green candlestick with a short body, and a long red candlestick that closes below the low of the first green candlestick. This pattern suggests that upward momentum is fading, and a potential reversal to a downtrend is imminent.
Expert Insights and Trading Tips
Seasoned traders often incorporate candlestick patterns into their trading strategies to enhance their decision-making process. Here are some invaluable tips from industry experts:
- Consider the context: Candlestick patterns should not be interpreted in isolation. Analyze them within the broader market context, including trend direction, support and resistance levels, and volume.
- Combine patterns: Using multiple candlestick patterns in conjunction can provide a more accurate assessment of market sentiment. Look for confirmation signals from different patterns.
- Beware of false signals: Not every candlestick pattern will result in a profitable trade. Exercise caution and consider the overall market conditions and volatility before making any trading decisions.
FAQs: Unraveling Common Queries
Q: Are candlestick patterns reliable?
A: Candlestick patterns, while not infallible, can provide valuable insights into market sentiment when used in conjunction with other technical analysis tools.
Q: How many candlestick patterns are there?
A: There are numerous candlestick patterns, but a select group of proven formations commonly used by traders.
Q: Can I make money trading candlestick patterns?
A: Candlestick patterns can enhance trading strategies, but successful trading requires a comprehensive understanding of market dynamics and risk management techniques.
Reading Candlestick Patterns
Conclusion: Embracing the Power of Candlesticks
Candlestick patterns offer a potent tool for understanding market sentiment and identifying potential trading opportunities. By mastering the art of reading these formations, traders can unlock a wealth of insights, navigate market volatility, and refine their trading strategies.
Are you ready to delve into the fascinating world of candlestick patterns and elevate your trading game? Embrace the power of these enigmatic formations and harness their wisdom to make informed decisions. Let the candlesticks be your guide as you embark on this captivating journey of market exploration.


